
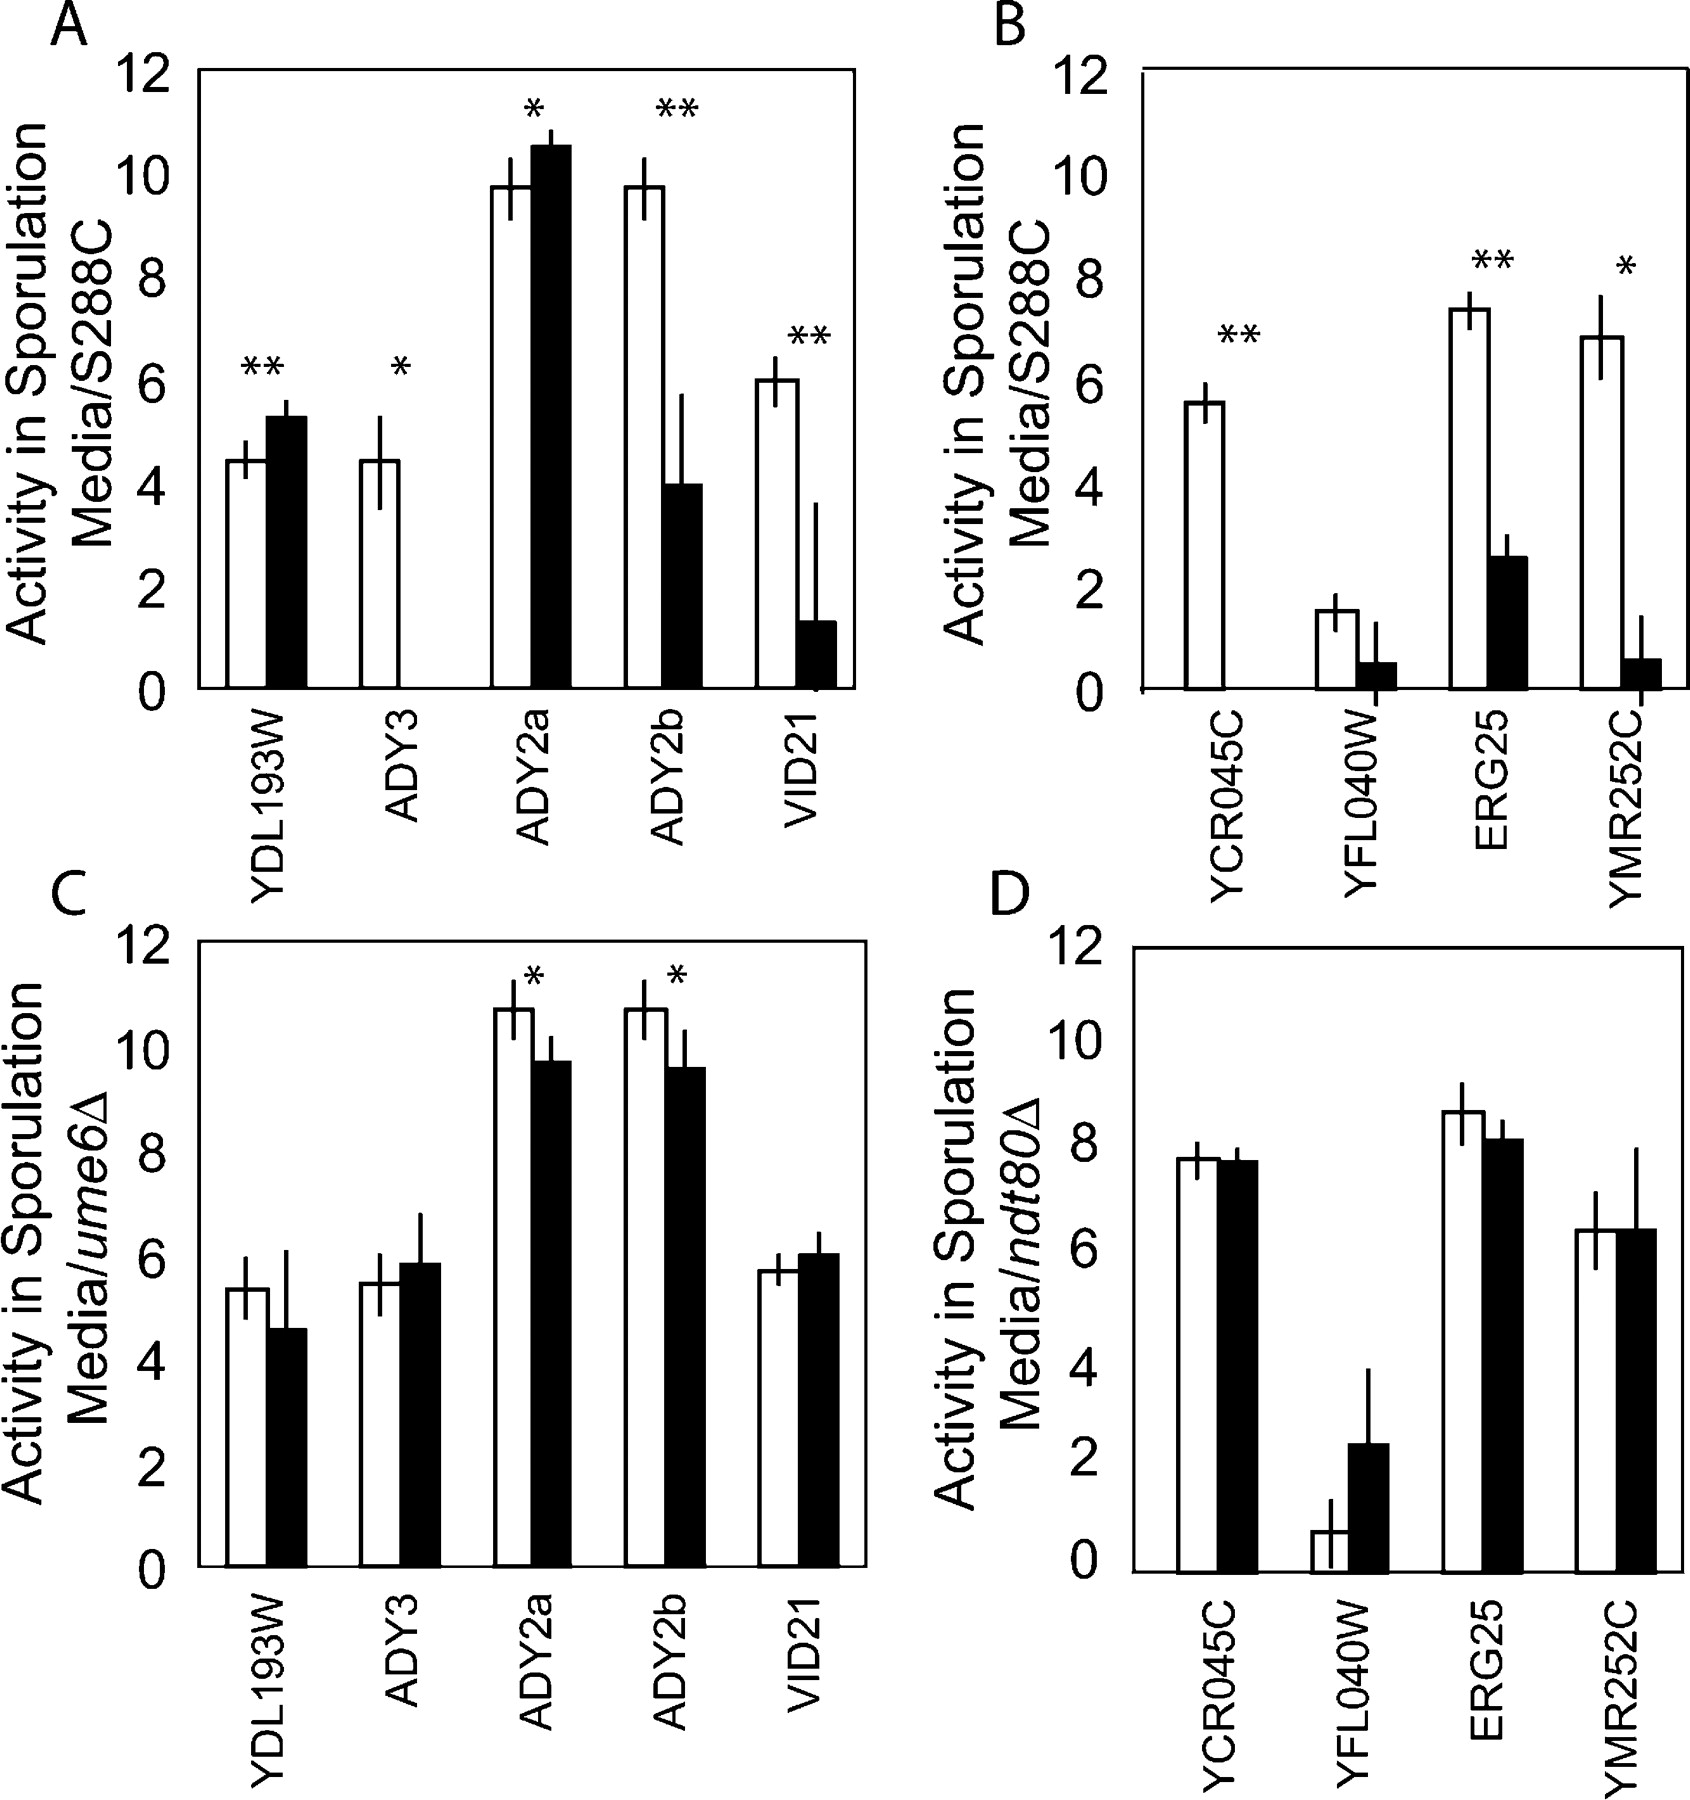
Figure 4.
(A) Expression levels from five S. cerevisiae promoters containing wild-type (white) or mutant (black) Ume6 sites after8hin sporulation media. (B) Expression levels from four promoters containing wildtype (white) or mutant (black) Ndt80 sites after8hin sporulation media. Expression levels from wild-type and mutant promoters in an ume6Δ (C) or ndt80Δ (D) strain after8hin sporulation media. The data displayed are the log2 of the mean β-gal expression intensity of five biological replicates. * = P < 0.05, ** = P < 0.01, by Student's t-test.


