
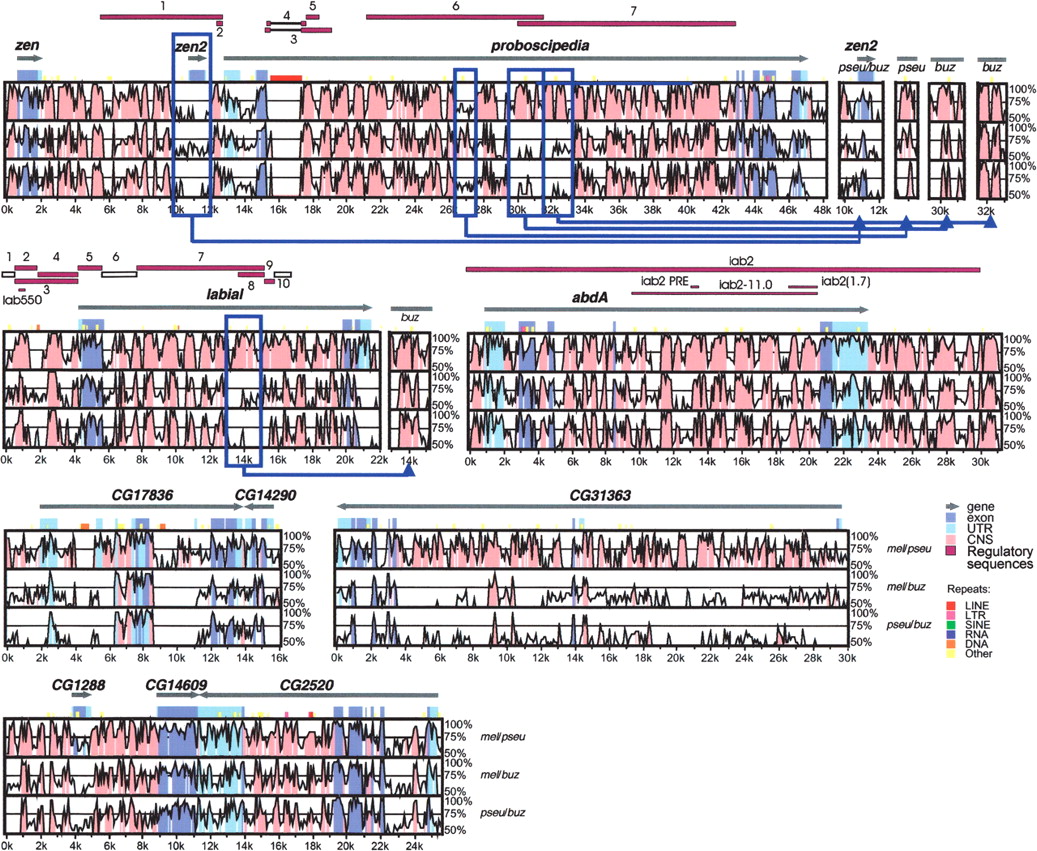
Nucleotide sequence conservation in the lab-abdA and pb regions between Drosophila species. The three panels in each VISTA plot represent pairwise comparisons between D. melanogaster and D. pseudoobscura (mel/pse), D. melanogaster and D. buzzatii (mel/buz) and D. pseudoobscura and D. buzzatii (pse/buz). The x-axis represents D. melanogaster coordinates, and y-axis sequence identity (50%–100%). Gray arrows show the location and orientation of genes. Conservation in exons and UTRs is shown in dark and light blue, respectively. Pink regions represent CNS. Experimentally identified regulatory sequences (solid purple bars) or segments with negative results (empty bars) are indicated on top of each plot. Five microinversions detected in the lab or pb regions are enclosed in blue frames, and the VISTA graphs generated with the inverted sequences shown to the right of the main plots. VISTA plots for the CG17836-CG14290, CG31363, and CG1288-CG14609-CG2520 regions (adjacent to Hox genes) are shown at the bottom of the figure for comparison.


