
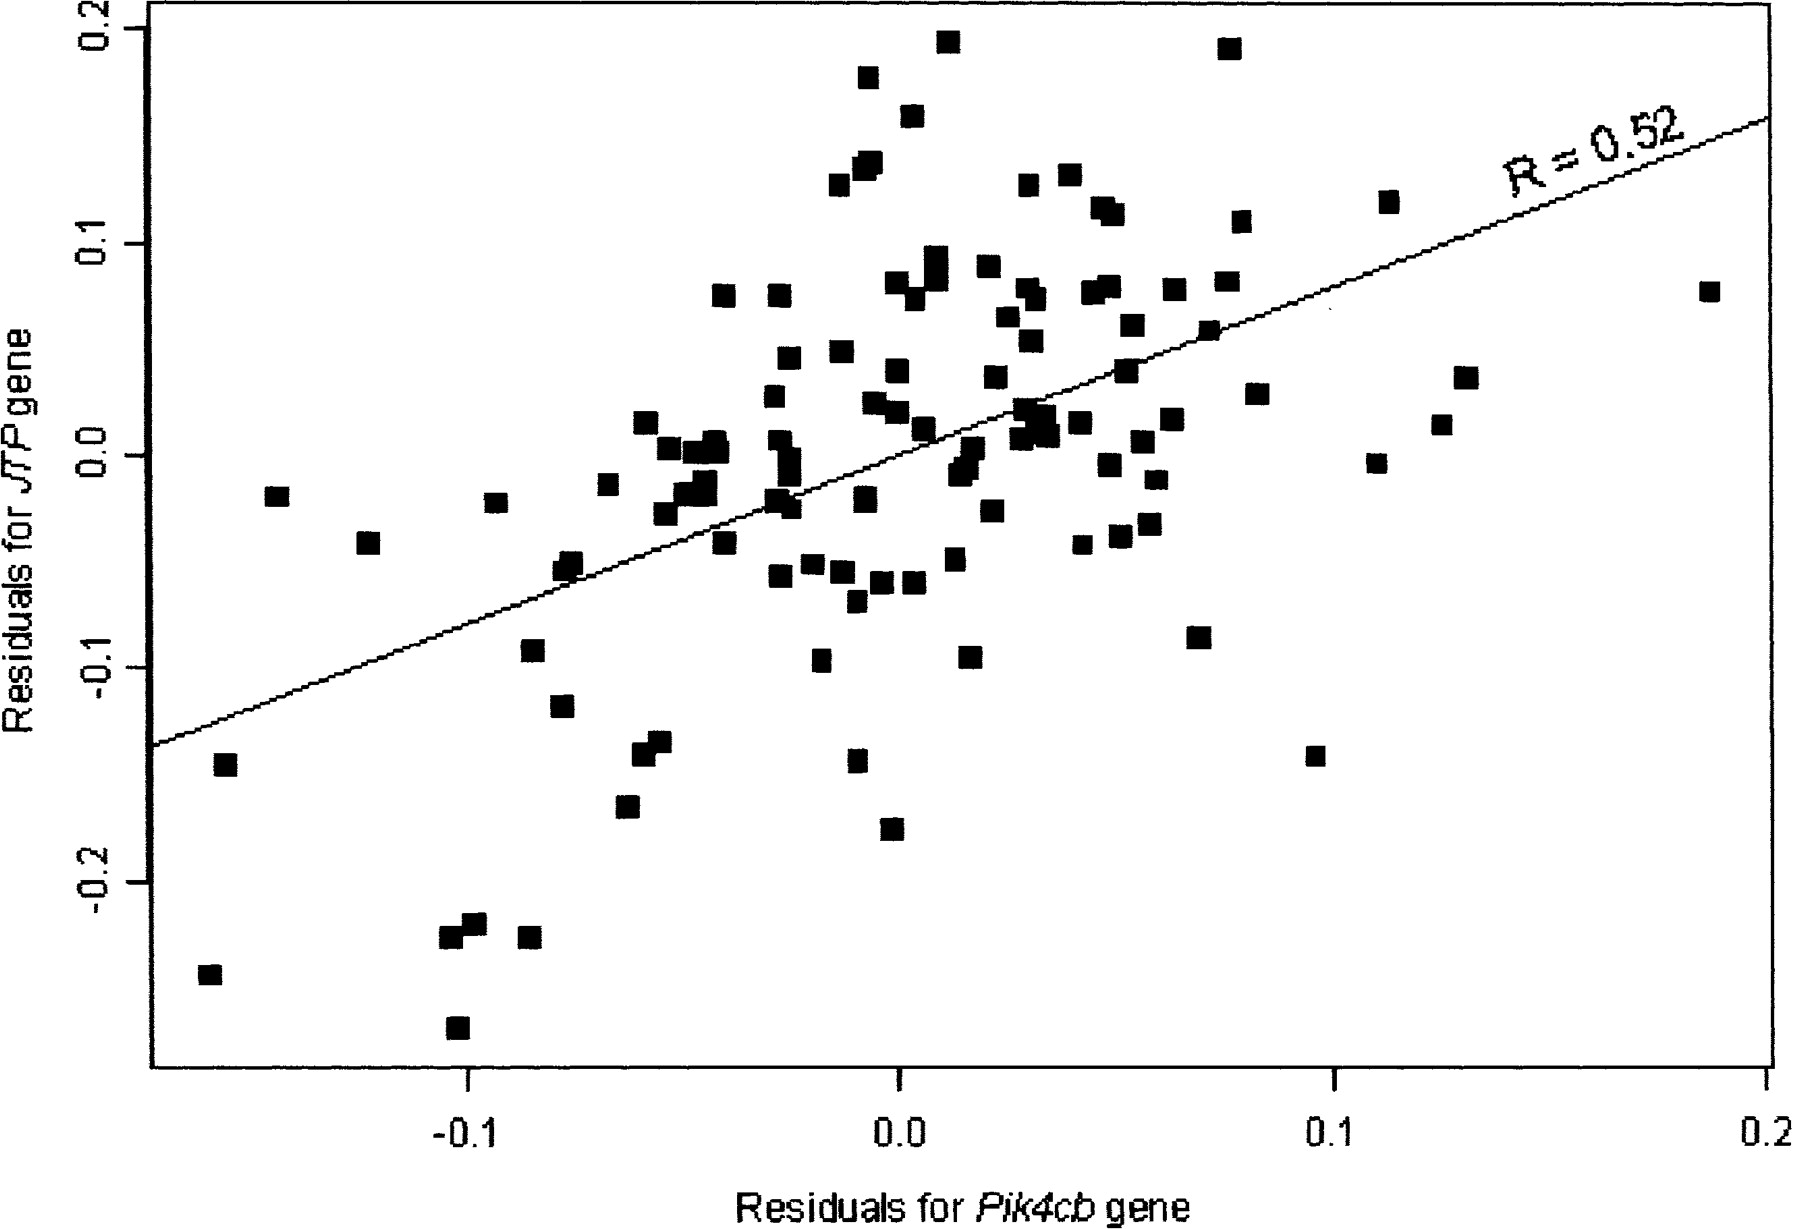
Figure 6.
Highlighting what may be the biologically relevant component of the correlation between the JTP and Pik4cb gene-expression traits. This scatter plot represents the correlation between the JTP and Pik4cb gene-expression traits conditional on the locus at the JTP and Pik4cb gene locations. The overall correlation in this instance is now significantly positive, almost identical to the overall correlation given in Figure 4, but opposite in sign. Using the overall correlation statistic between these two traits as shown in Figure 4 completely obscures this relationship.


