
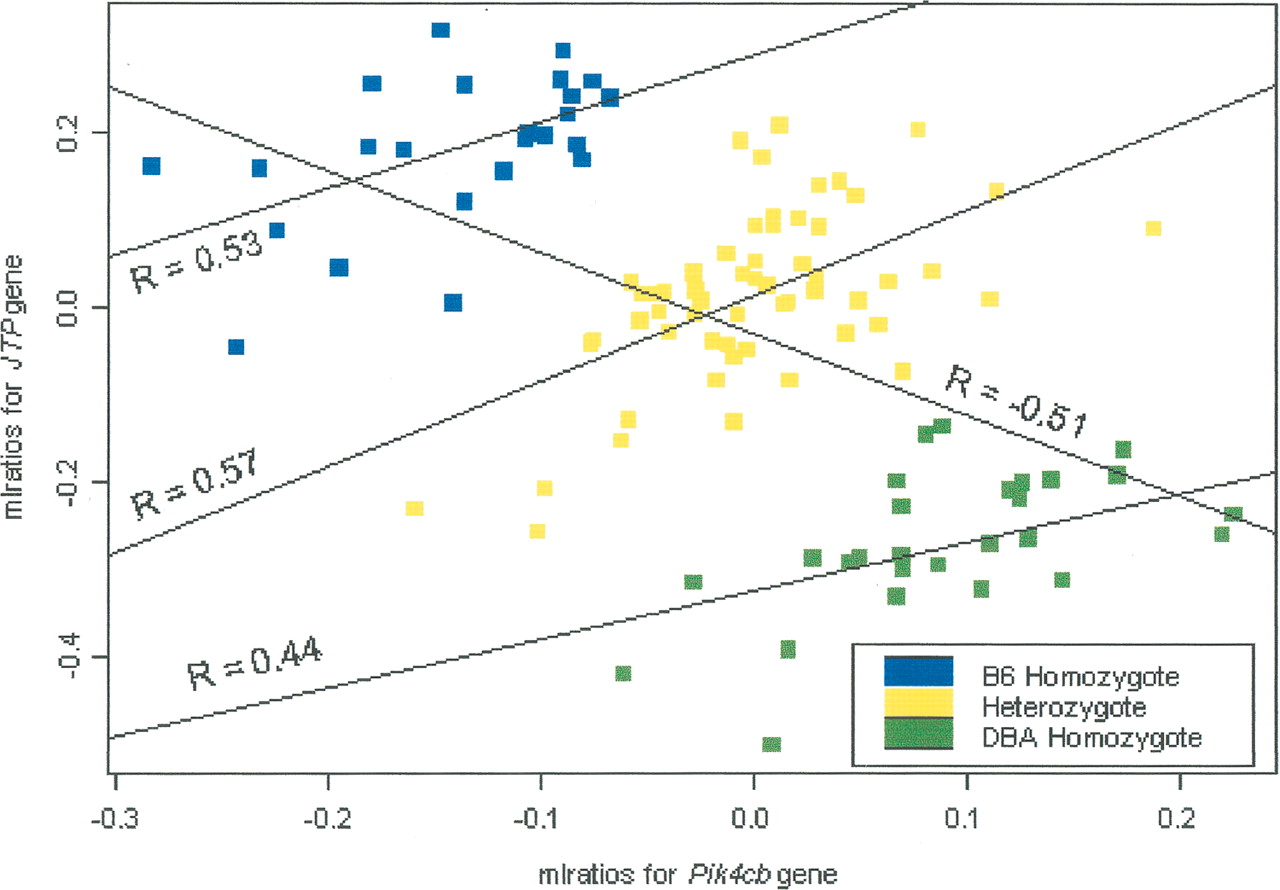
Scatter plot of the mlratios for the jumping translocation point (JTP) and phosphatidylinositol 4-kinase, catalytic, β polypeptide (Pik4cb) genes in the BXD set. Color coding of each point is given with respect to the genotypes at a locus coincident with the physical location of the JTP and Pik4cb genes (the grouping indicates strong cis-acting eQTL for each gene). The overall correlation is computed to be –0.51, a statistically significant correlation (P = 7.8 × 10⁻⁹). The correlation within each genotype group is seen to be statistically significant as well, with a correlation of 0.53 in the B6 group, a correlation of 0.57 in the heterozygote group, and a correlation of 0.44 in the DBA group. Interestingly, the overall correlation is opposite in sign to each of the within-group correlations.


