
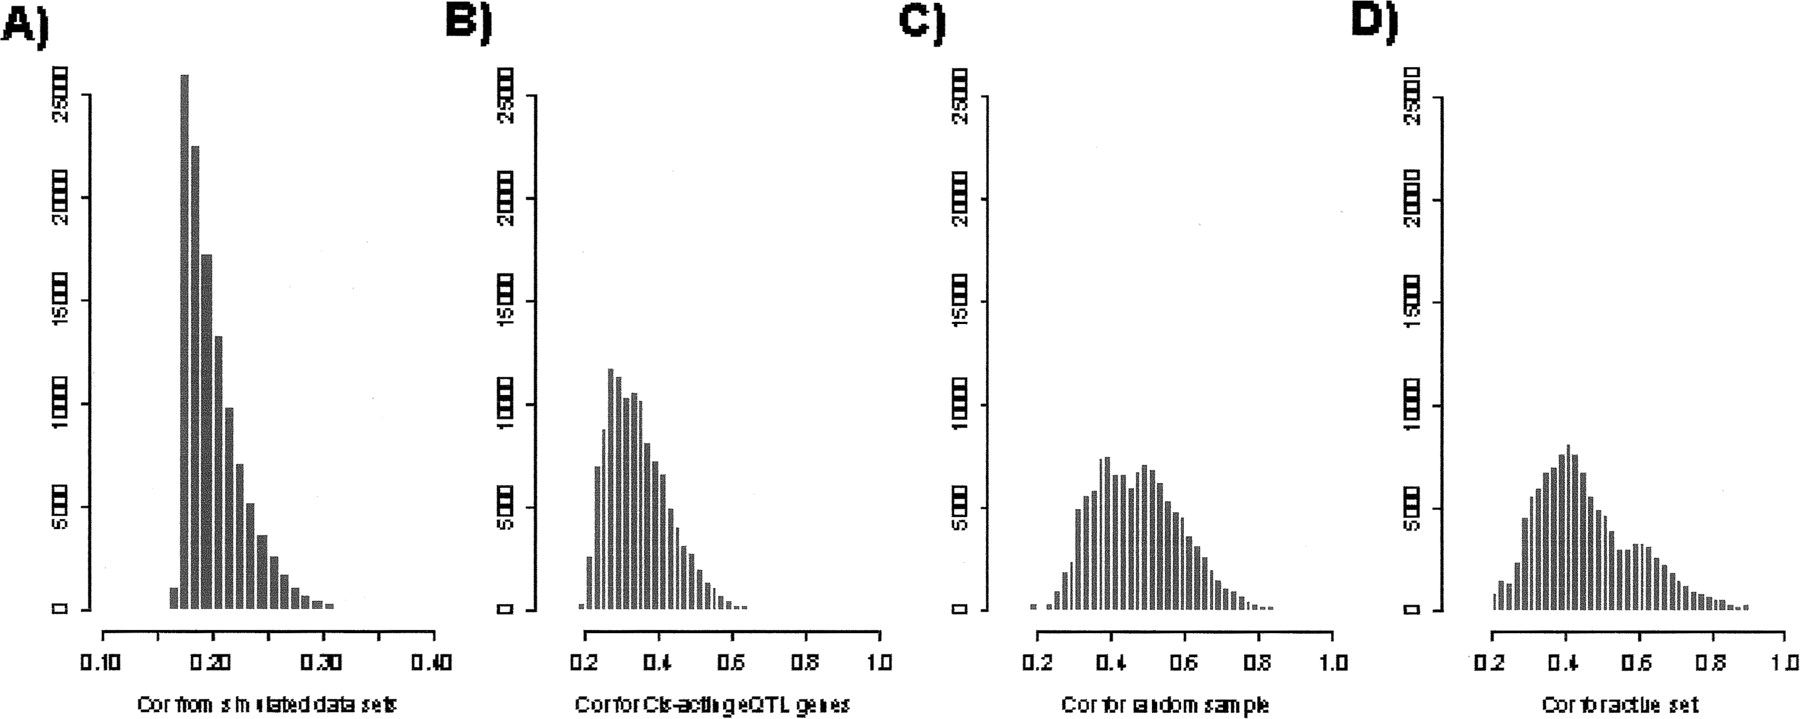
Significant differences in the distribution of Pearson correlation coefficients involving genes with strong cis-acting eQTL versus genes with weak or no cis-acting eQTL. For each gene considered, the Pearson correlation coefficient was computed between the ml ratio vector for the gene from the BXD population and the ml ratio vectors for every other gene monitored in the BXD population (23,472 genes), resulting in a correlation vector for each gene. Histograms for the correlation coefficients whose significances fell in the ninth percentile were plotted in A–D for different sets of genes. (A) Distribution of correlations for 100 simulated mlratio vectors, representing the random distribution expected if 100 genes with independent mlratio vectors are compared with 23,472 other mlratio vectors assumed to be independent of the 100 simulated mlratio vectors. (B) Correlation distribution for the 100 genes with the strongest cis-acting eQTL in the BXD data set; all cis-acting eQTL in this set had LOD scores >15. (C) Correlation coefficient distribution for 100 genes randomly chosen from the set of 23,500 genes represented on the microarray in the BXD set. (D) Correlation coefficient distribution for 100 genes randomly chosen from the set of most transcriptionally active genes in the BXD set.


