
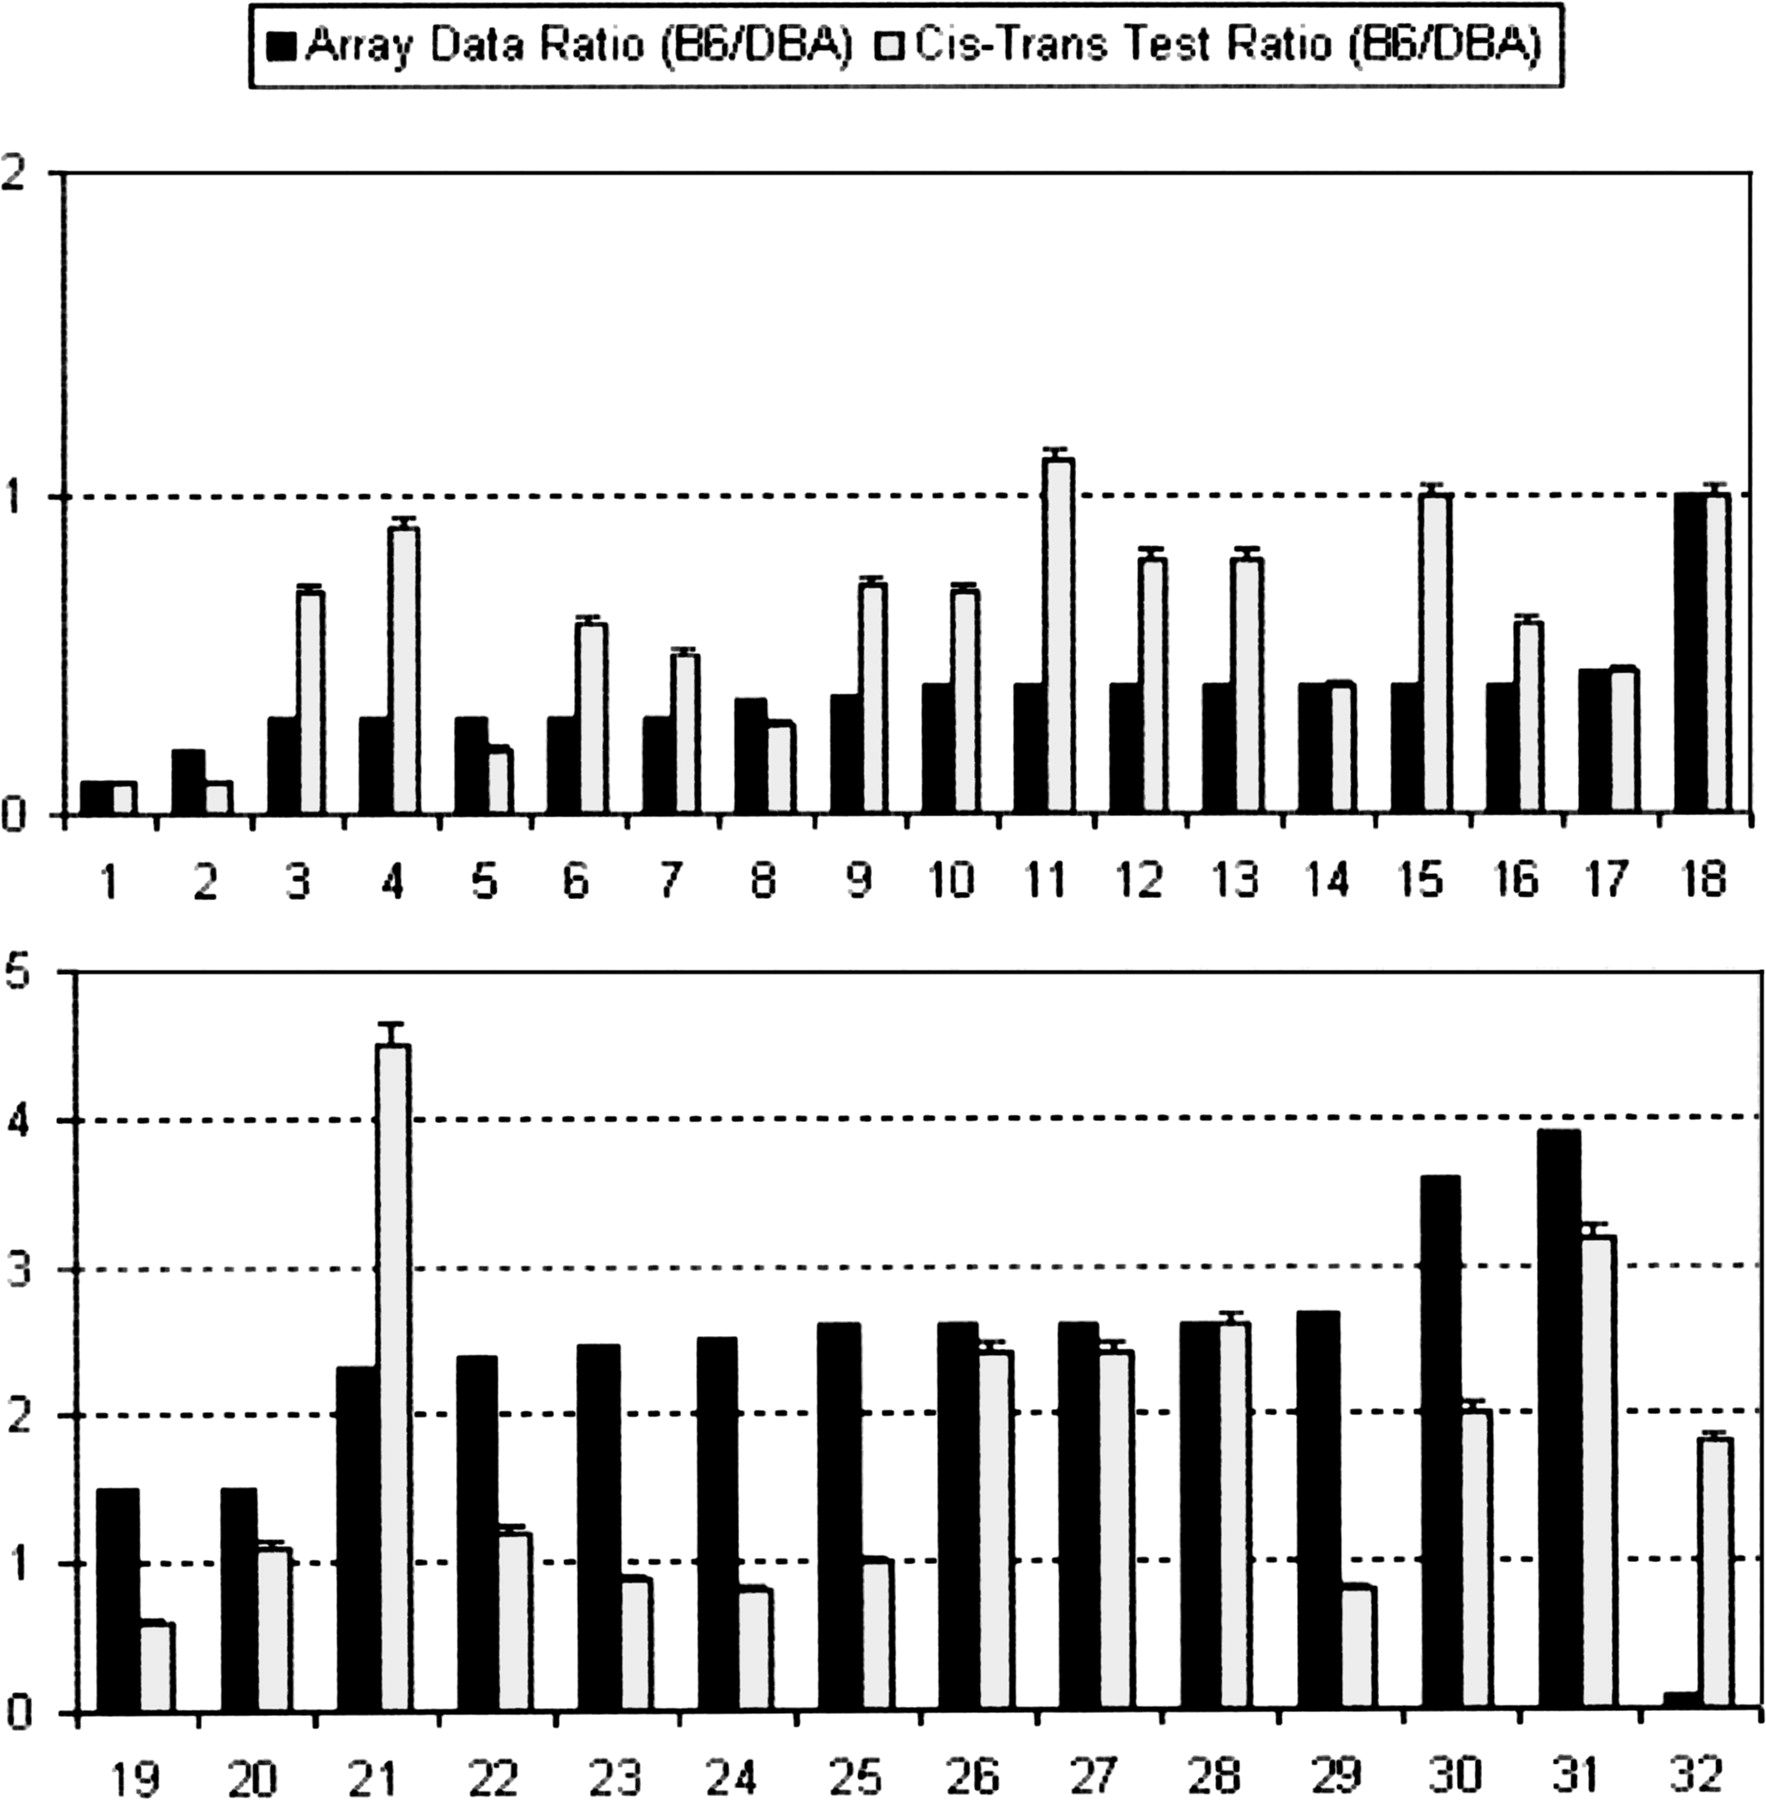
Figure 2.
Results of cis–trans test on a subset of cis-acting eQTLs. See Table 1 for GenBank accession numbers corresponding to gene numbers. Black bars indicate B6:DBA ratio observed in previously described microarray data (Schadt et al. 2003). Light gray bars indicate the observed ratio from the cis–trans test and are displayed with standard error bars. A total of 19 of 29 genes confirm the mode of regulation observed in the microarray data according to our definition described in the text.


