
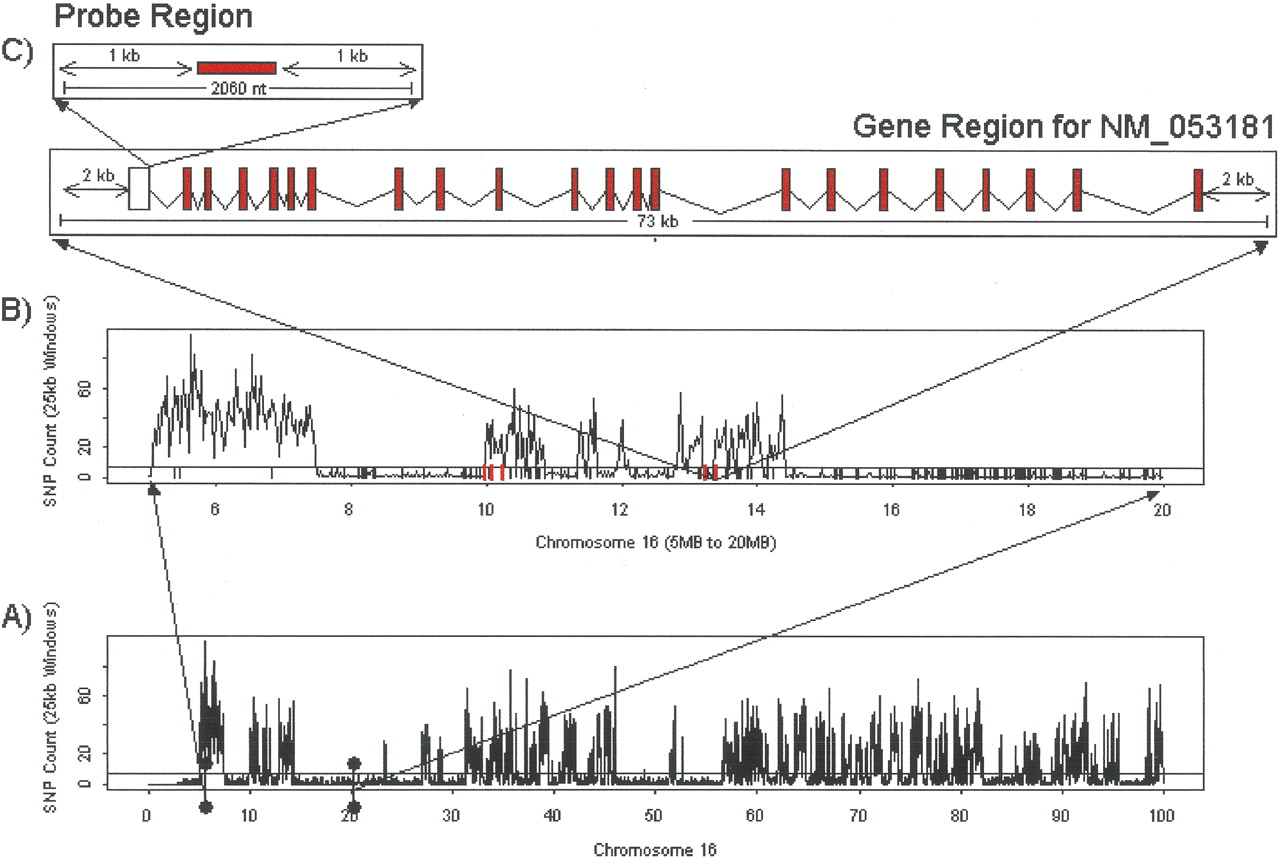
Figure 1.
Informative SNP frequency across chromosome 16 between B6 and DBA. The horizontal line in graphs A and B represents the threshold of five SNP/25 kb. Regions with five or less SNPs in a 25-kb interval were designated IBD between B6 and DBA. (A) The entire chromosome 16; (B) a closer look at an ∼15-Mb region on proximal chromosome 16, where the small vertical red lines at the base of the figure represent genes with cis eQTL in this region. (C) further zooms in on NM_053181, depicting the boundaries for the various regions considered in the SNP overlapping probe analysis.


