
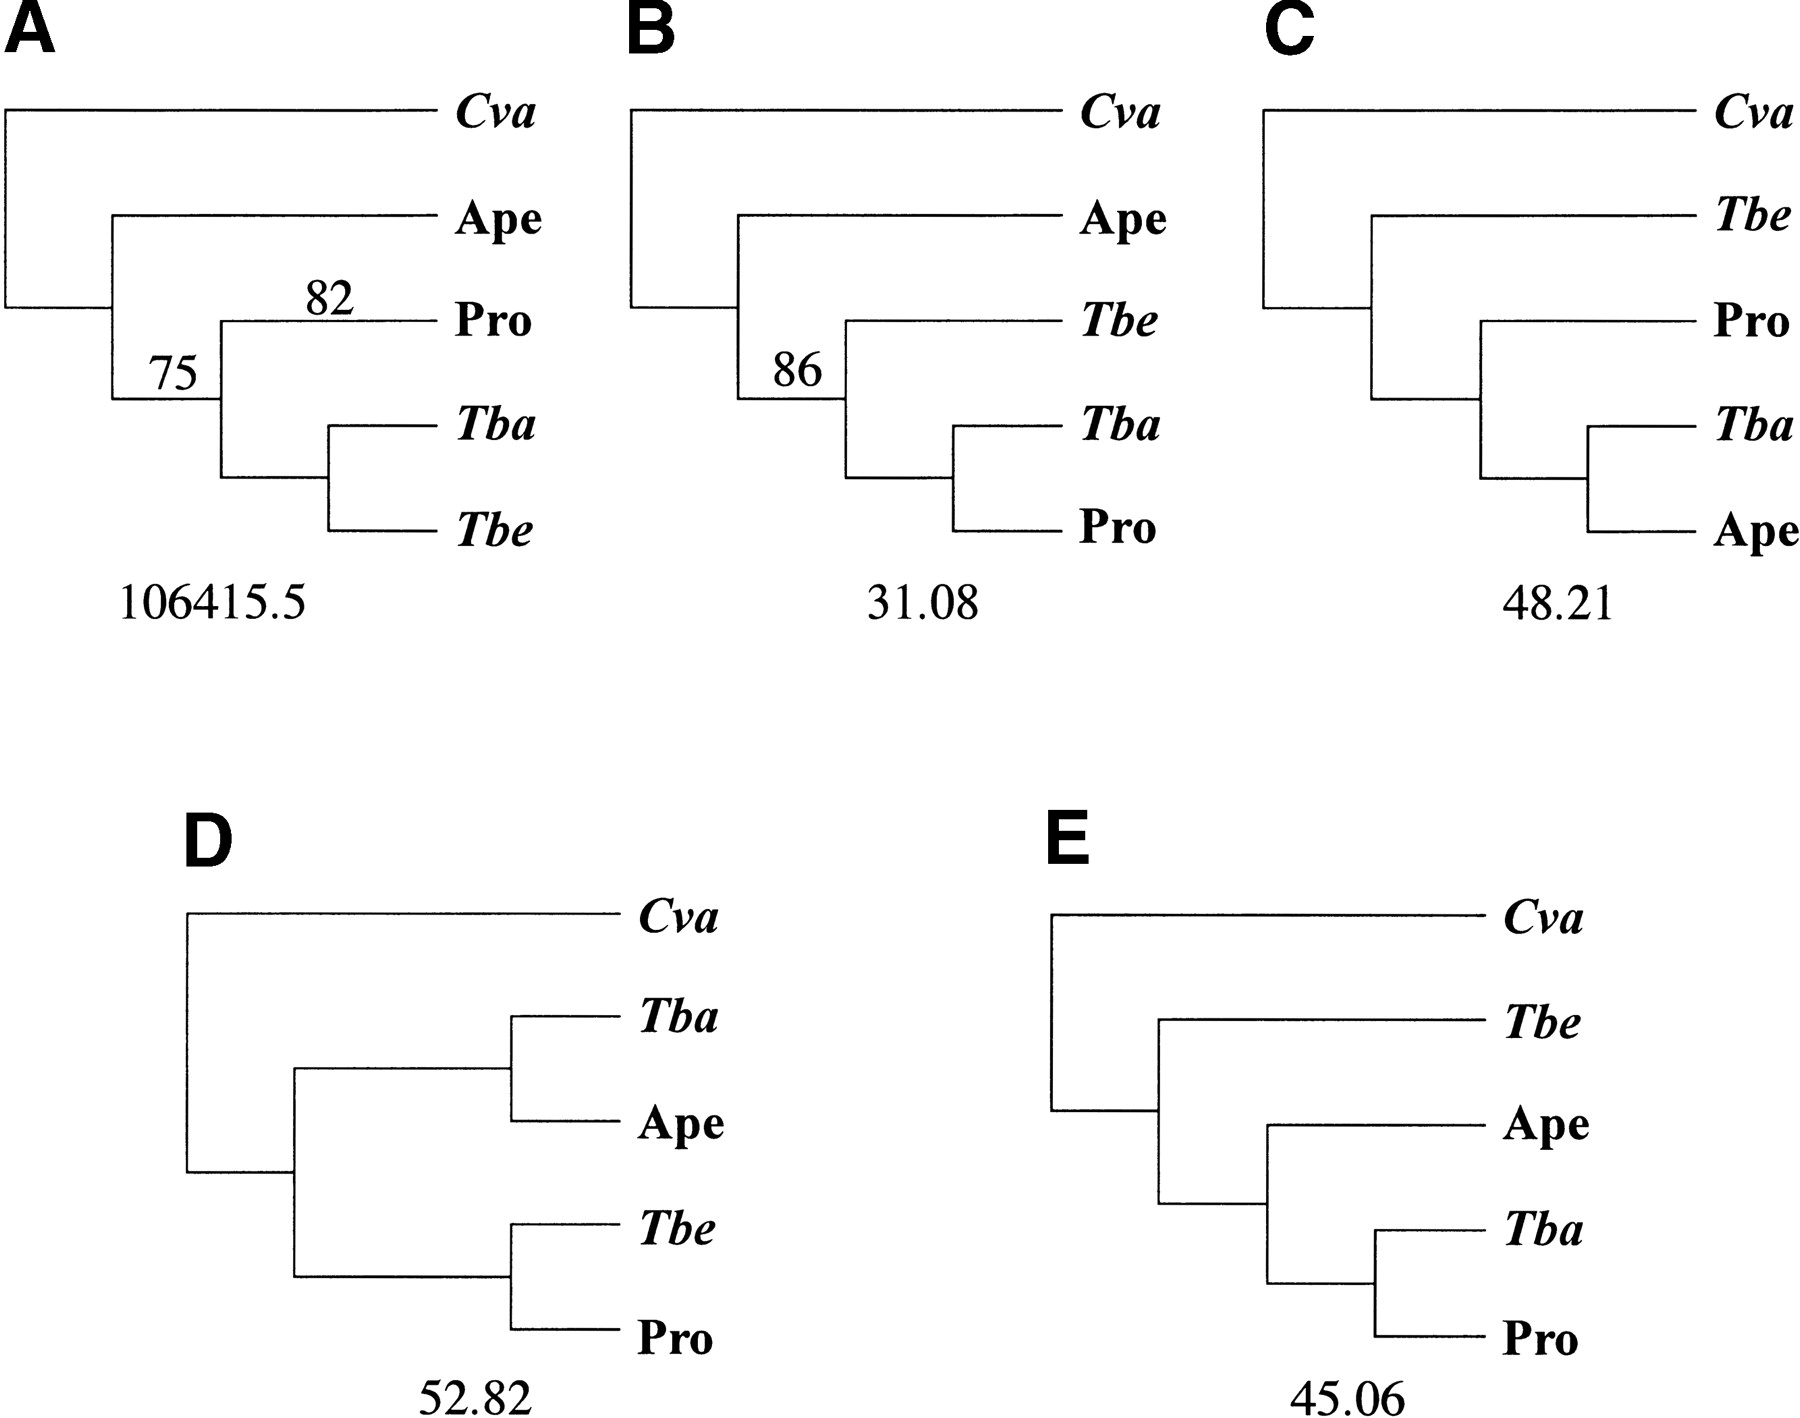
Figure 7.
Comparison of the most likely trees relating the deeply diverging primate groups and outgroups. Bootstrap values for the DNA-based NJ analysis are shown on (A) when <100%. Posterior probabilities for the nucleotide Bayesian analysis were 100%, and the one branch <100% in the amino acid analysis is shown in (B). The likelihood is shown for (A), the most likely topology under the DNA-based analysis, and differences from the most likely tree are shown underneath topologies (B–E).


