
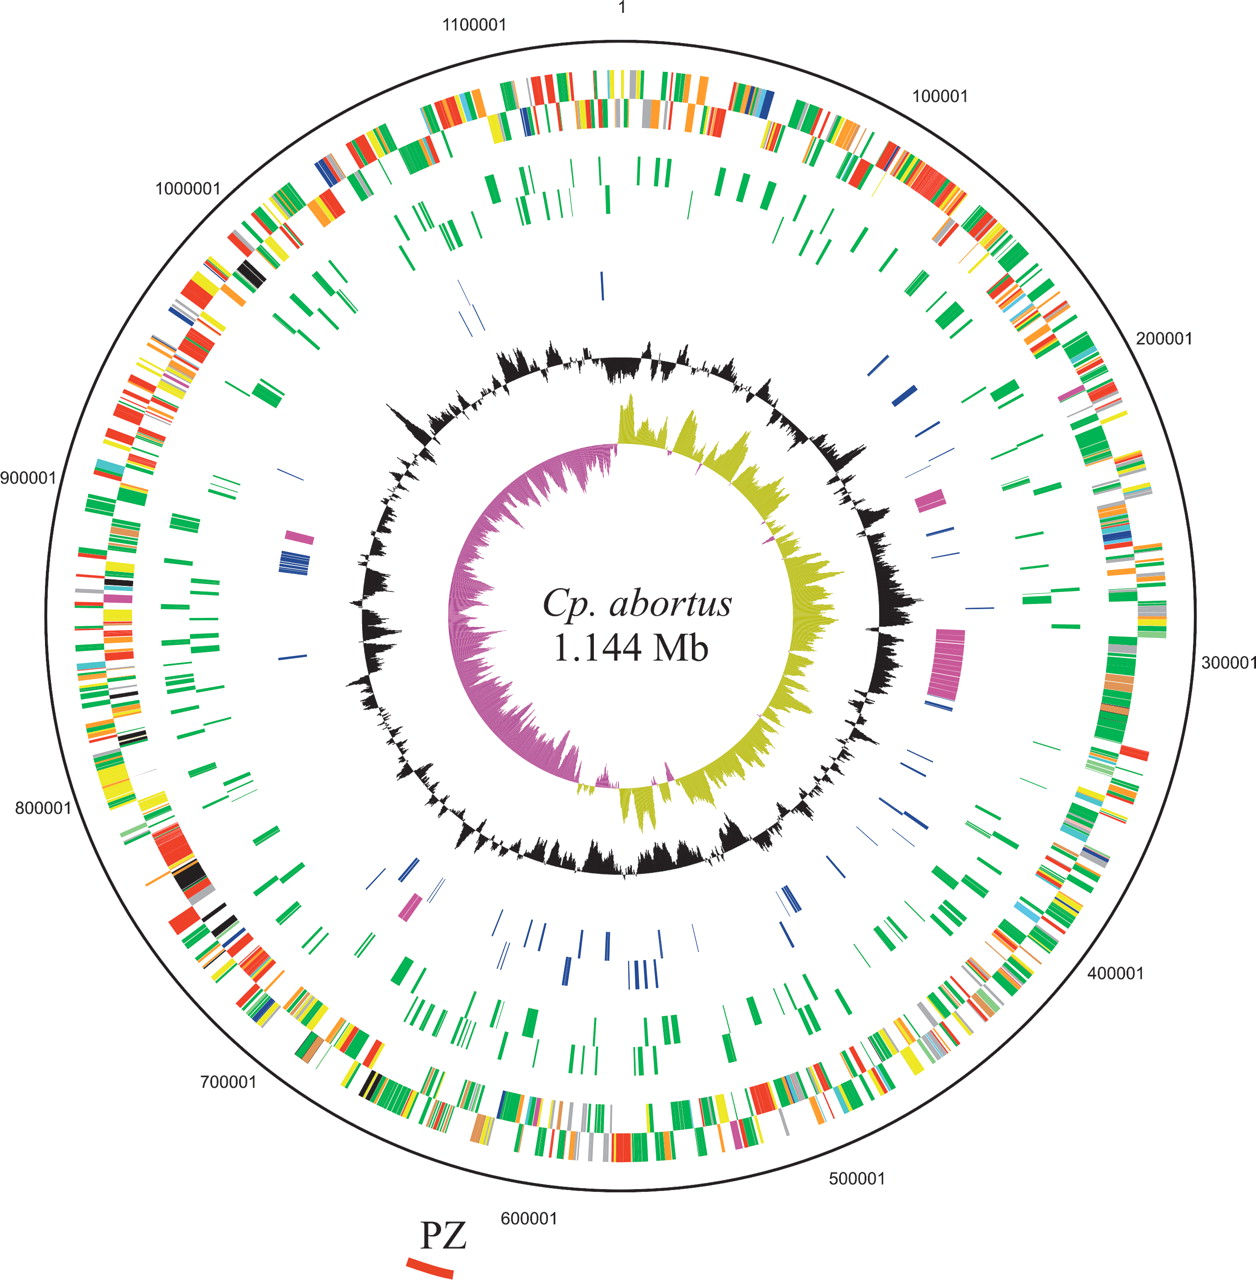
Circular representation of the Cp. abortus chromosome. The outer scale shows the size in base pairs. From the outside in, circles 1 and 2 show the position of genes transcribed in a clockwise and anticlockwise direction, respectively (for color codes, see below); circles 3 and 4 CDS encoding all membrane proteins (green) minus the Pmp and TMH/Inc-family proteins in the clockwise and anticlockwise directions, respectively; circles 5 and 6 show members of the Pmp (purple) and TMH/Inc protein families (blue) in the clockwise and anticlockwise directions, respectively. Circle 7 shows a plot of G+C content (in a 10-kb window); circle 8 shows a plot of GC skew ([G–C]/[G+C]; in a 10-kb window). Genes in circles 1 and 2 are color coded according to the function of their gene products: (dark green) membrane or surface structures; (yellow) central or intermediary metabolism; (cyan) degradation of macromolecules; (red) information transfer/cell division; (purple) degradation of small molecules; (pale blue) regulators; (dark blue) pathogenicity or adaptation; (black) energy metabolism; (orange) conserved hypothetical; (pale green) unknown; (brown) pseudogenes. The position of the plasticity zone (PZ) is shown as a red arc outside of the scale ring.


