
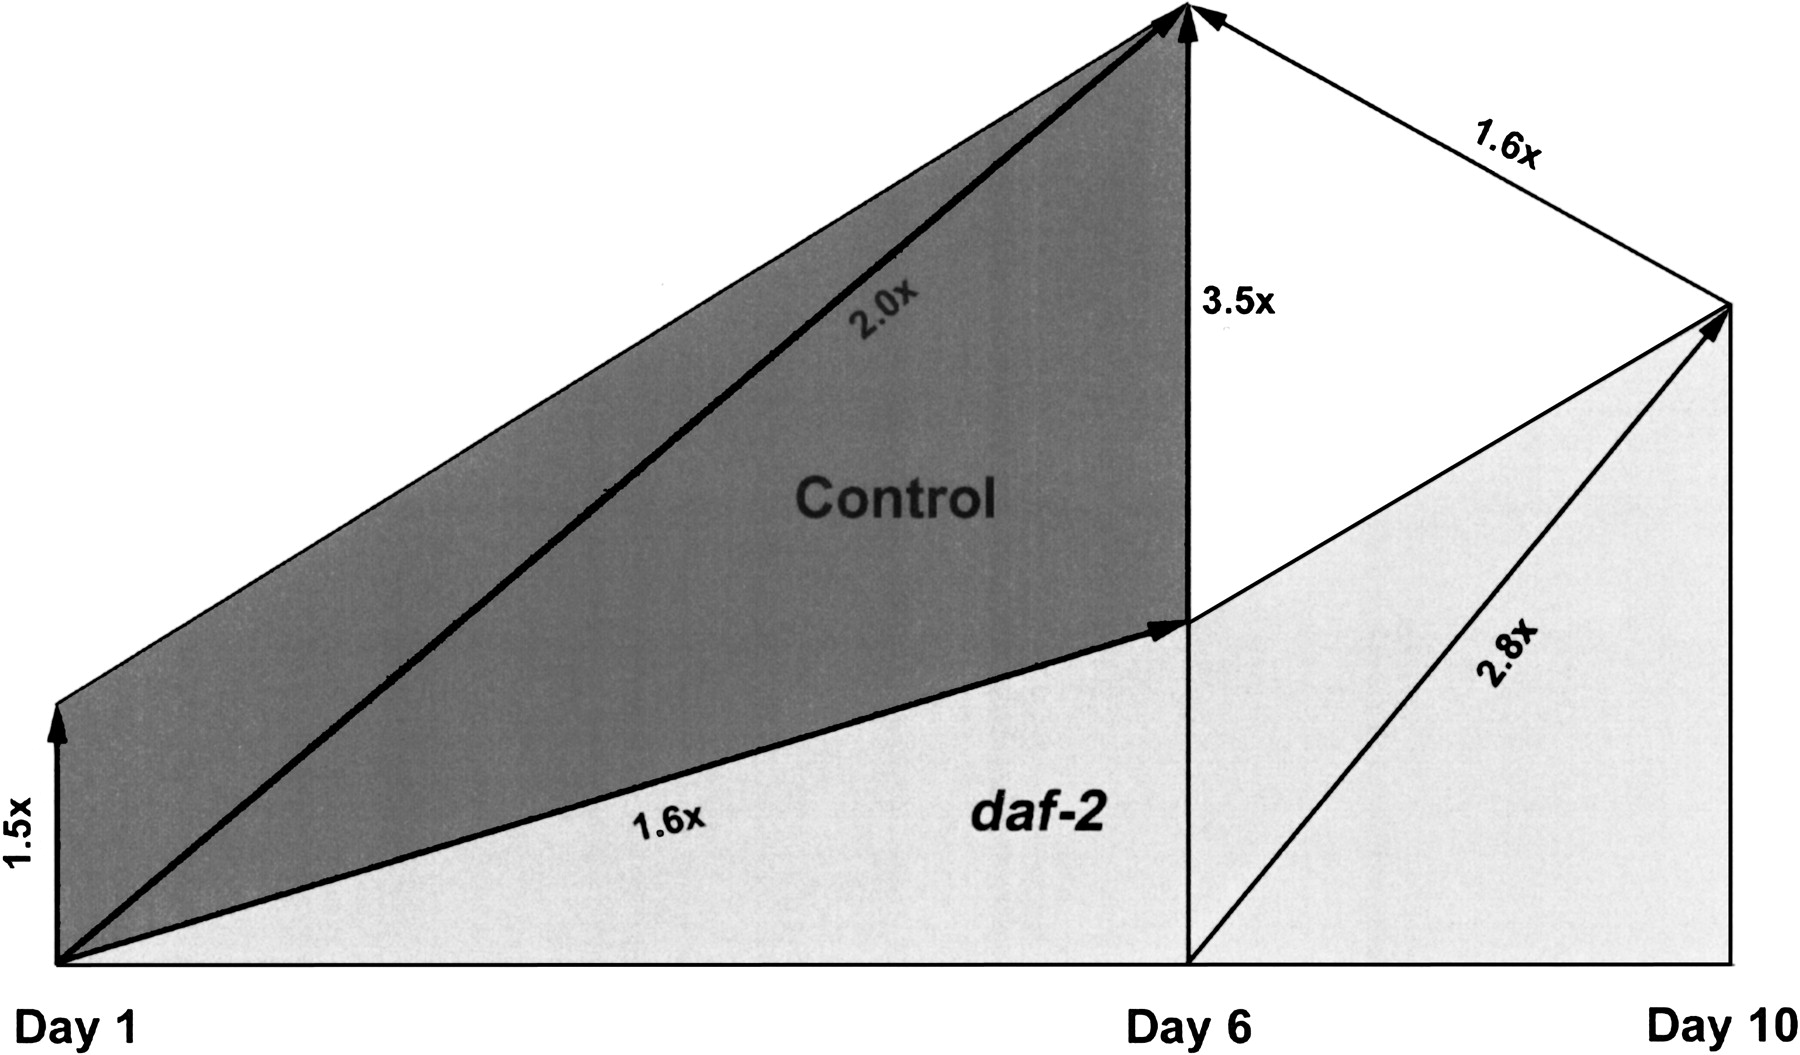
Figure 6.
Global gene expression differences of metabolism-associated genes in daf-2 and control worms. The graph schematically illustrates metabolic activity in mutant and control worms. Fold differences of all differentially expressed metabolism-associated genes between SAGE libraries are indicated. Arrowheads point to the SAGE library with the higher metabolic activity in a given comparison. Generally, metabolism-associated transcripts were more abundant in controls than in daf-2, and metabolic activity also increased with age.


