
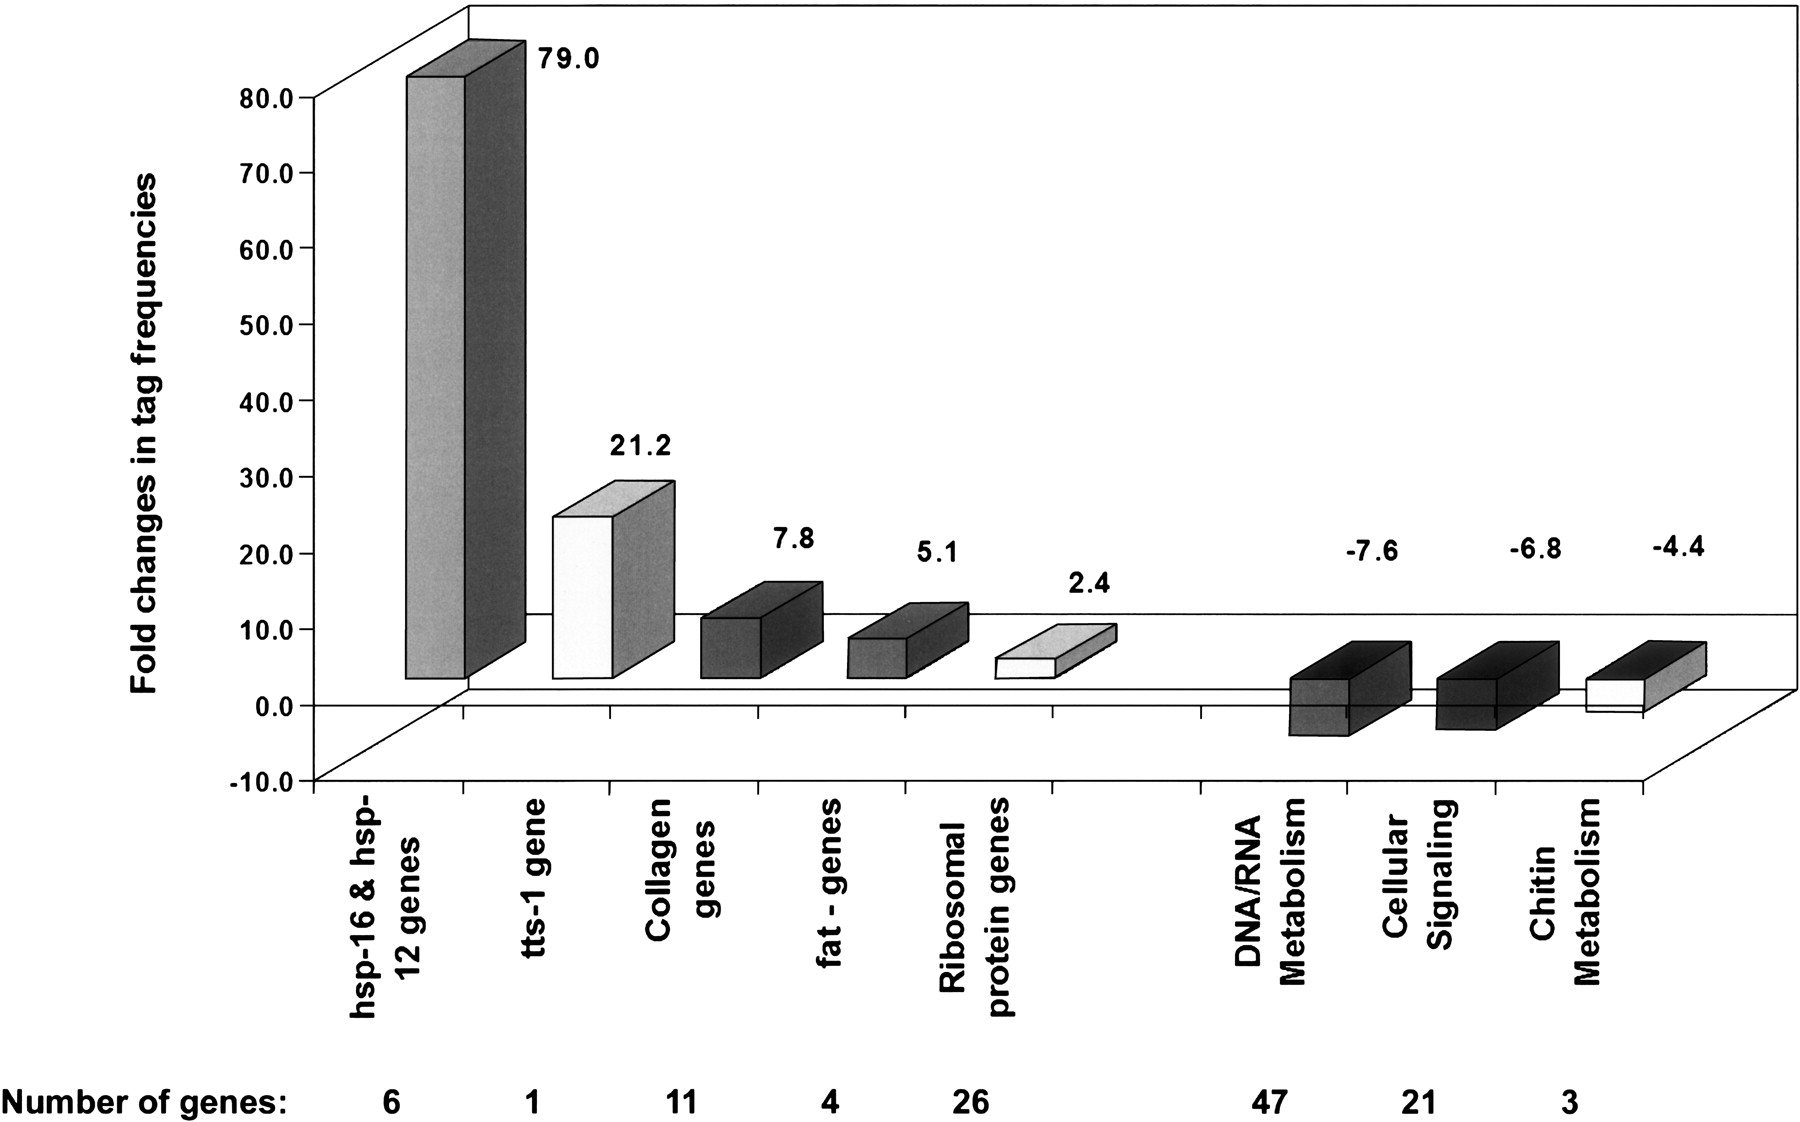
Figure 4.
Expression analysis of 10-d-old daf-2 and 6-d-old control worms. Genes matching our selection criteria were classified based on biological function. Mean fold differences for all genes within a group are shown. The numbers of genes constituting these groups are indicated. Differences in metabolic activities seen in daf-2 on day 6 are noticeably reversed.


