
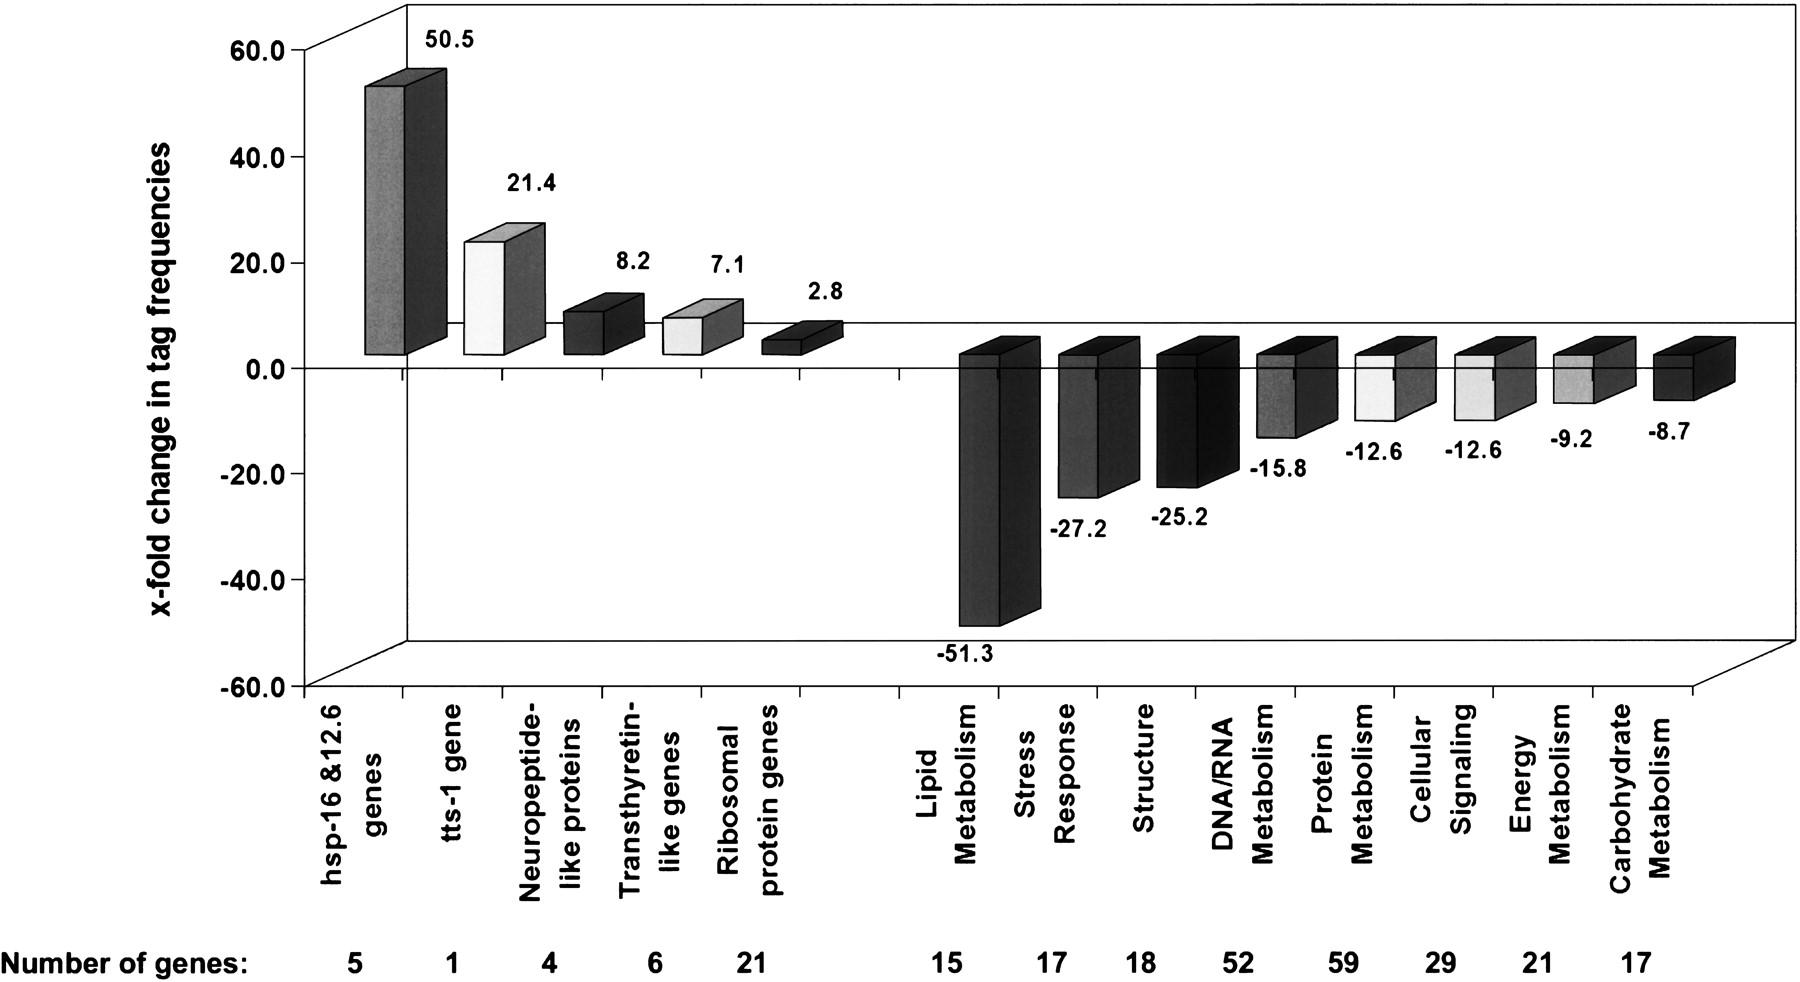
Figure 3.
Expression analysis of 6-d-old daf-2 and control worms. Genes matching our selection criteria were classified according to biological function. Mean fold differences for these genes are shown. The numbers of genes constituting these groups are indicated. Genes associated with major metabolic pathways are expressed at lower levels in daf-2 mutants.


