
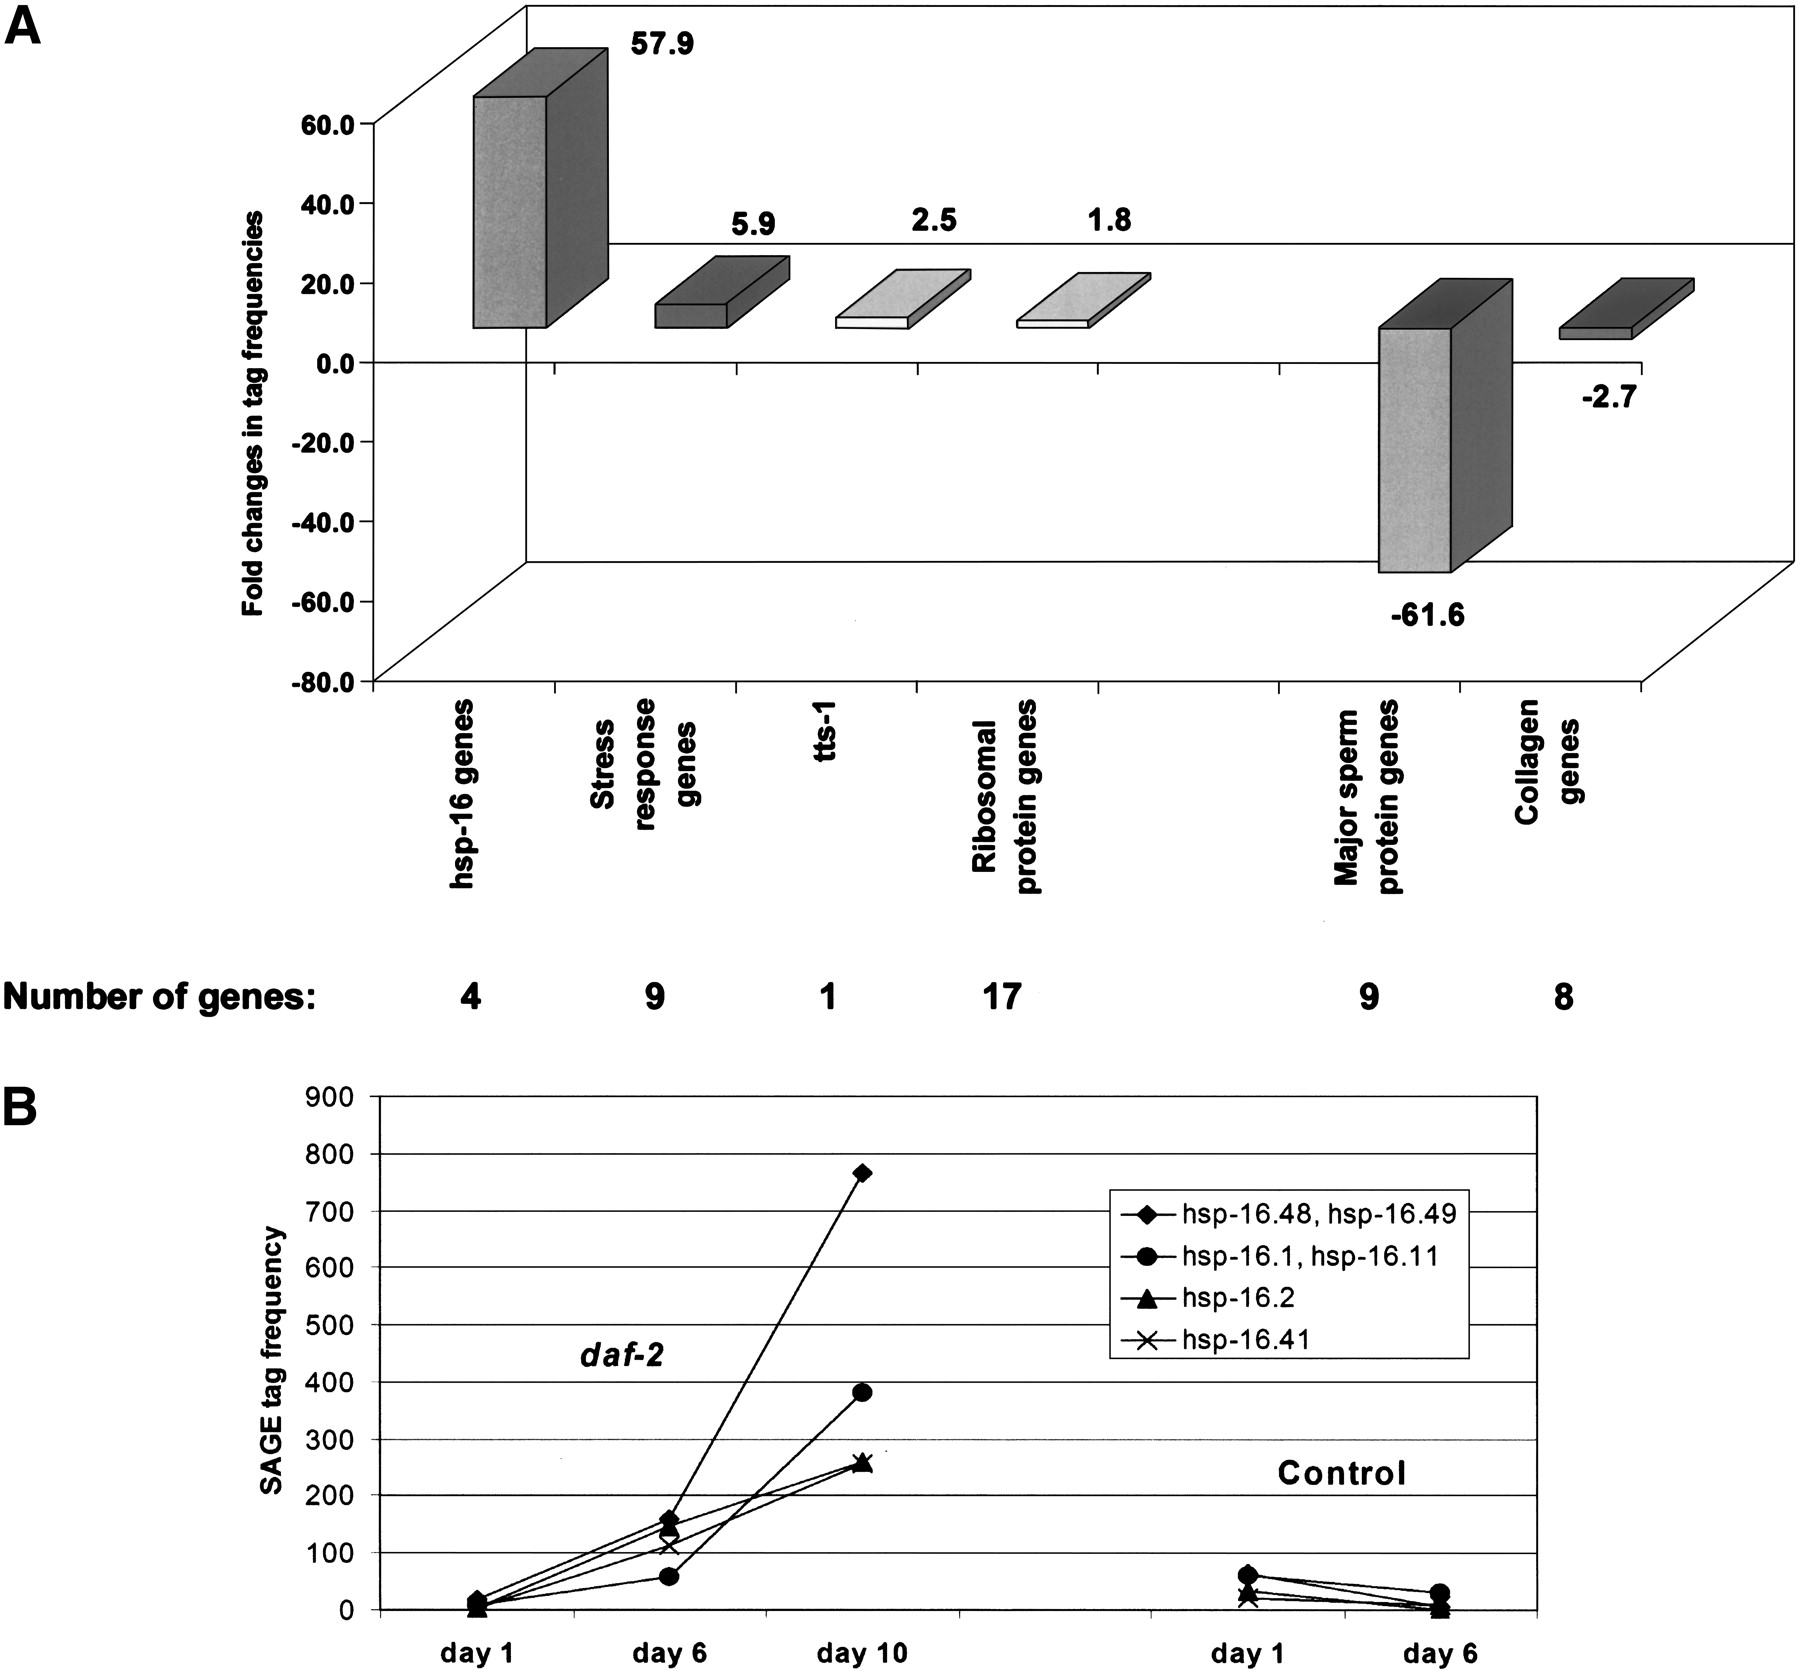
Expression analysis of daf-2 SAGE libraries. Gene expression was analyzed in daf-2 worms at days 1, 6, and 10 of adulthood. Tags that met our selection criteria were grouped according to biological function. Mean fold differences of tag abundance were calculated between day 1 and day 10 and are shown in (A). The number of genes within a given group or gene family is noted. (B) The expression profile of four hsp-16-like genes in daf-2 and control worms. Expression levels of these genes drastically increase (∼60-fold) over daf-2 lifespan but are only marginally expressed in controls. Genes that are plotted together are closely related and their SAGE tags are indistinguishable; these tag numbers represent the sum of SAGE tags for both genes.


