
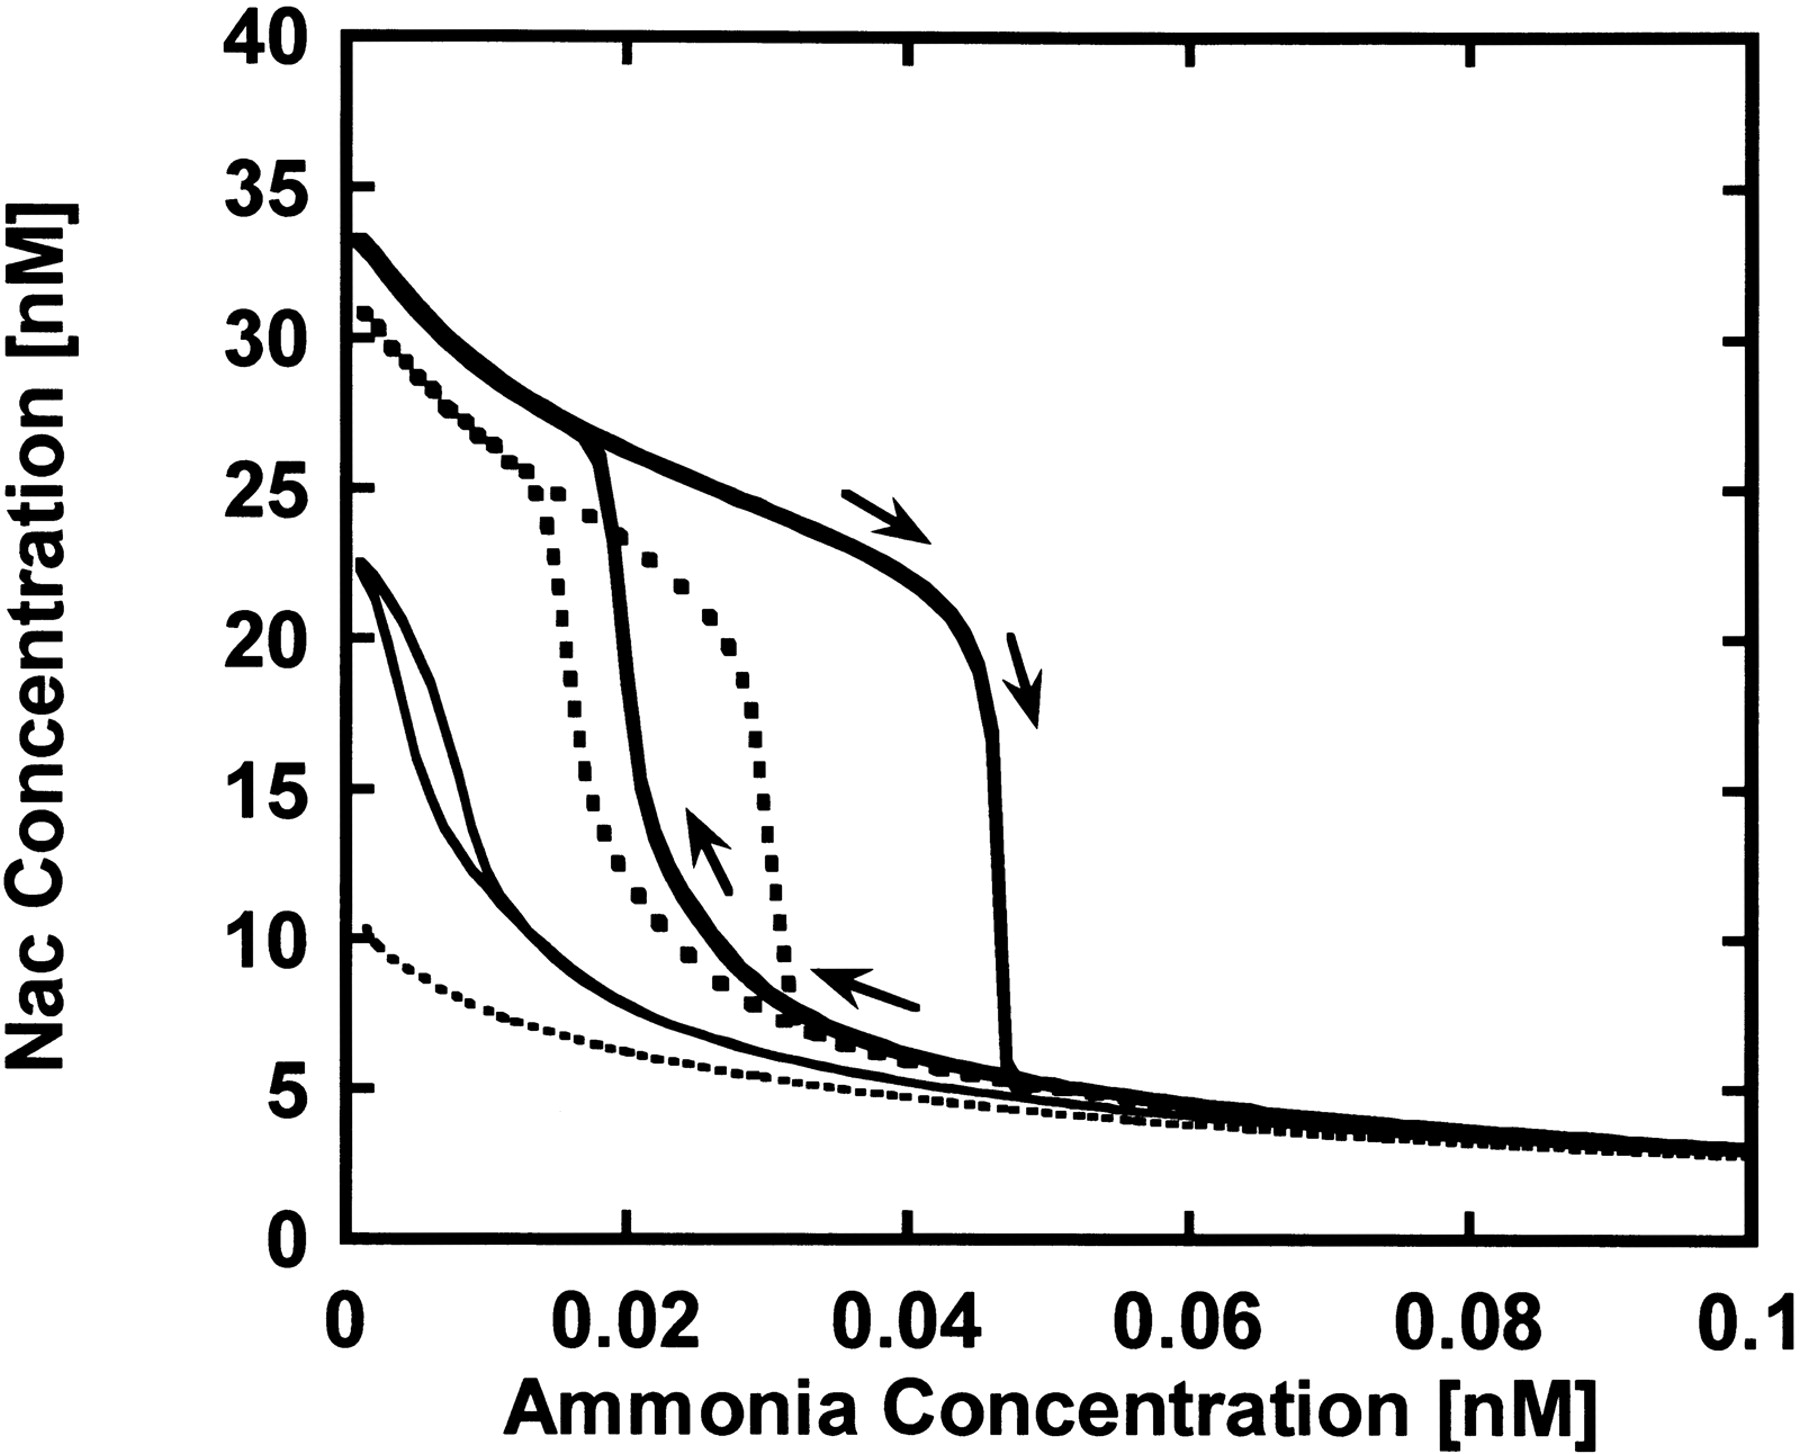
Figure 6.
Hysteresis curves of nac protein with respect to ammonia concentration in the wild-type and the GlnK mutants. The mutant lacking
GlnK ( ), the wild type: transcription rate for GlnK = 0.09 min-1 (
 ), the mutant overexpressing GlnK: transcription rate for GlnK = 0.45 min-1 (—), and the mutant that greatly overexpresses GlnK: transcription rate for GlnK = 0.9 min-1 (-------).


