
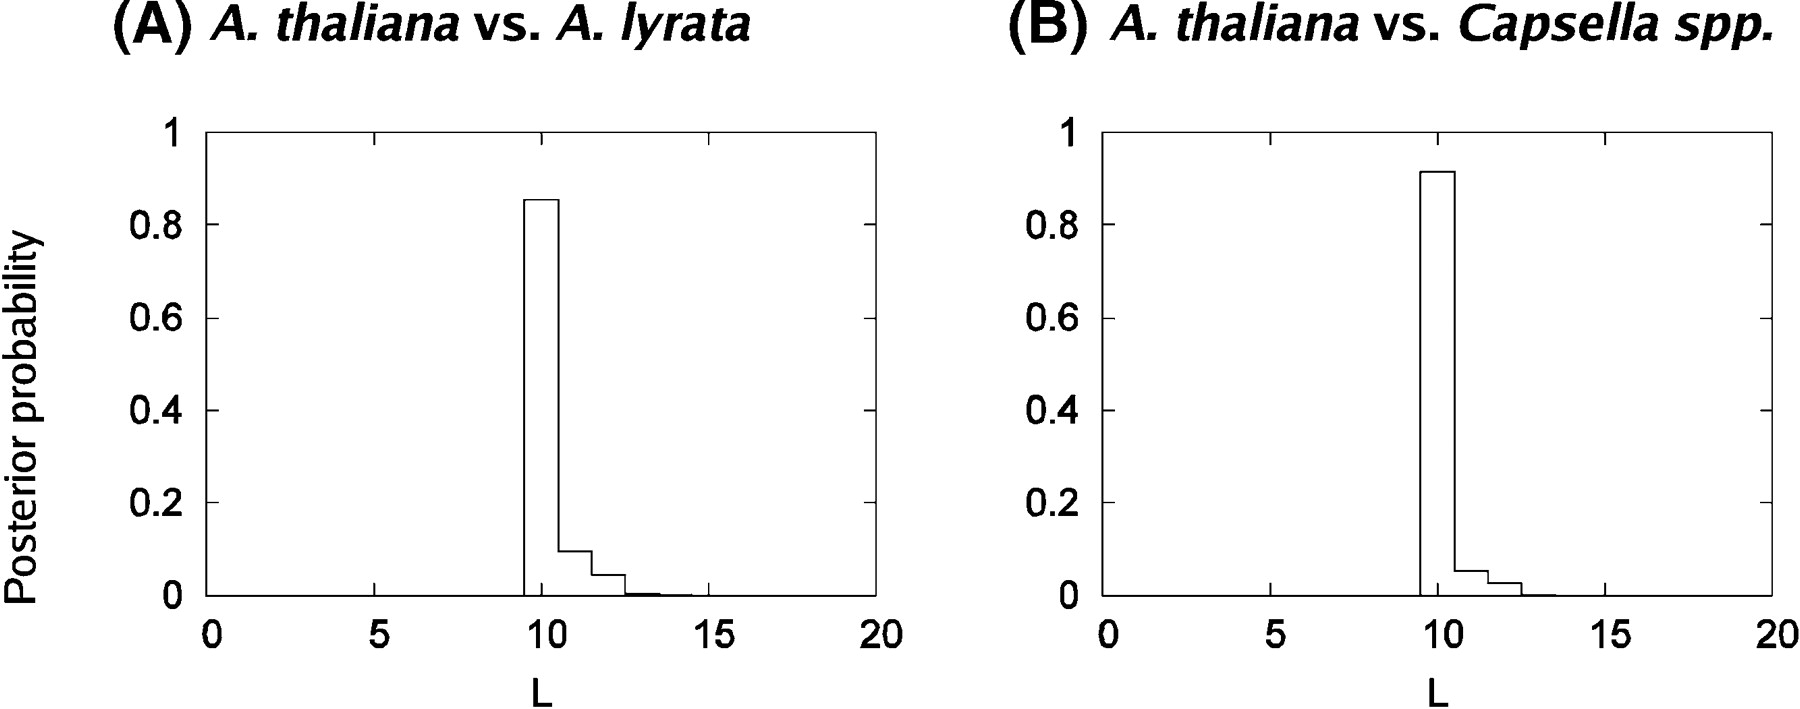
Figure 3.
Posterior probability plots of A. thaliana–A. l. lyrata and A. thaliana–Capsella mapping data considering marker order only. Posterior probability plots generated from Bayesian analyses of mapping data accounting for marker orders without distances. (A) A. thaliana–A. l. lyrata comparison. (B) A. thaliana–Capsella comparison. x-axis: L = estimate of the total number of observable rearrangements; y-axis: Posterior probability estimate for the number of observable rearrangements.


