
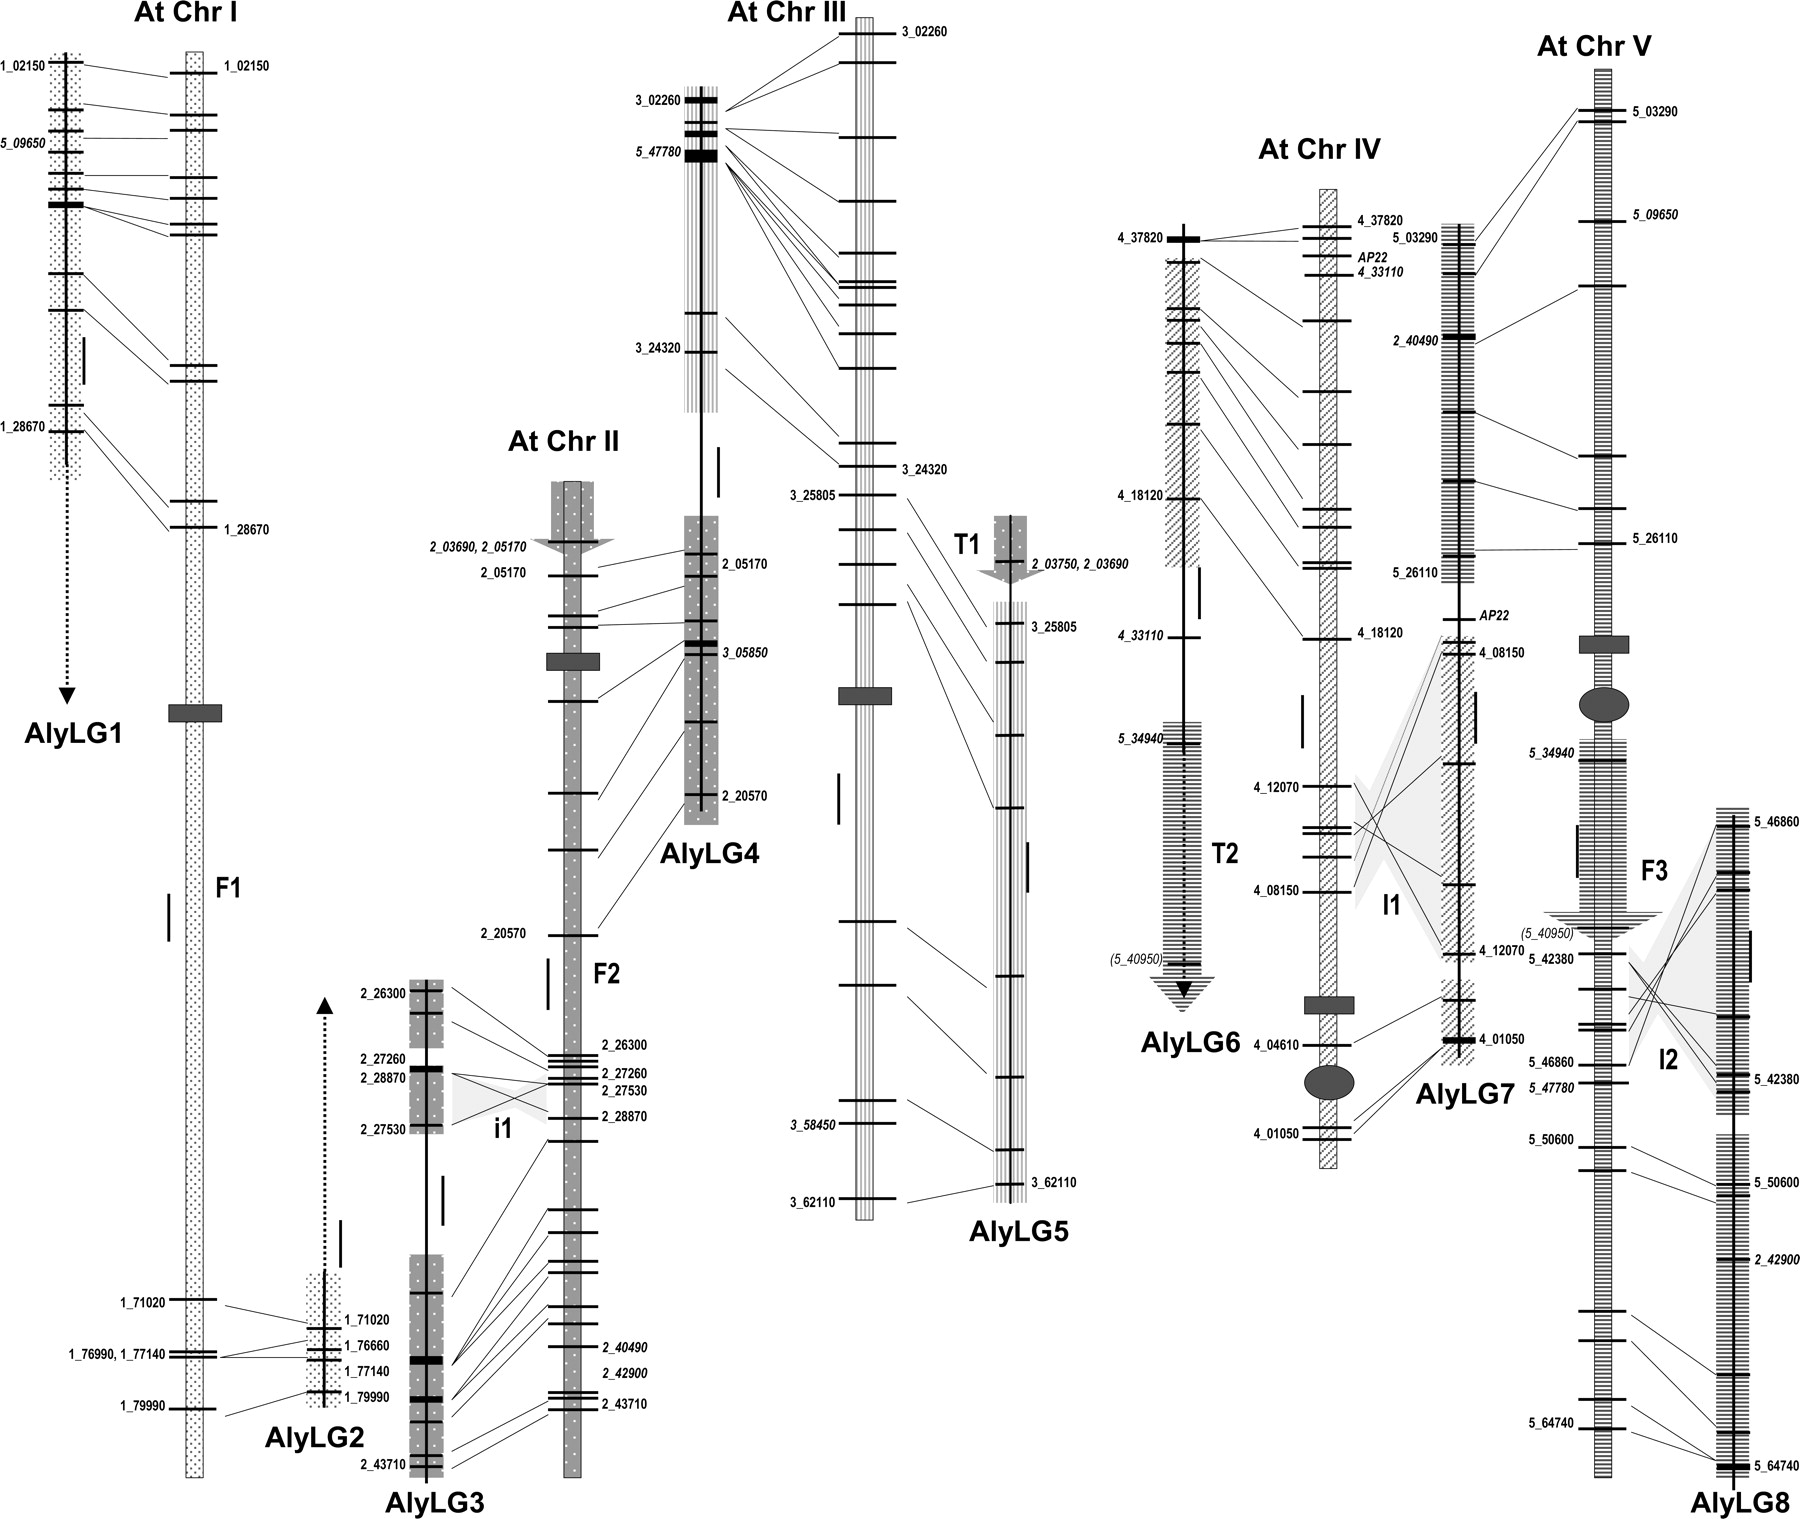
Colinearity of A. l. lyrata linkage map with the A. thaliana genome. A. thaliana chromosomes (At Chr I–V) are represented as patterned bars (drawn to scale, 1 unit = 1 Mbp; gray rectangles, centromeres; gray circles, heterochromatic knobs). A. l. lyrata linkage groups (Aly LG 1–8) are shown in black (drawn to scale, 1 unit = 5cM). Sixteen colinear blocks are highlighted with the same pattern as the At chromosome to which they correspond. Markers defining the ends of each colinear block are shown on the map in black lettering. Markers mapping with LOD score less than 3.0 are featured in parentheses. Italicized markers map to translocated or nonsyntenic regions in A. l. lyrata. Translocations T1 and T2 are highlighted by arrows whose patterns correspond to the At chromosome where their colinear region lies. Major inversions I1 and I2 and minor inversion i1 are highlighted in light gray. Three chromosomal fusions are denoted as F1-F3.


