
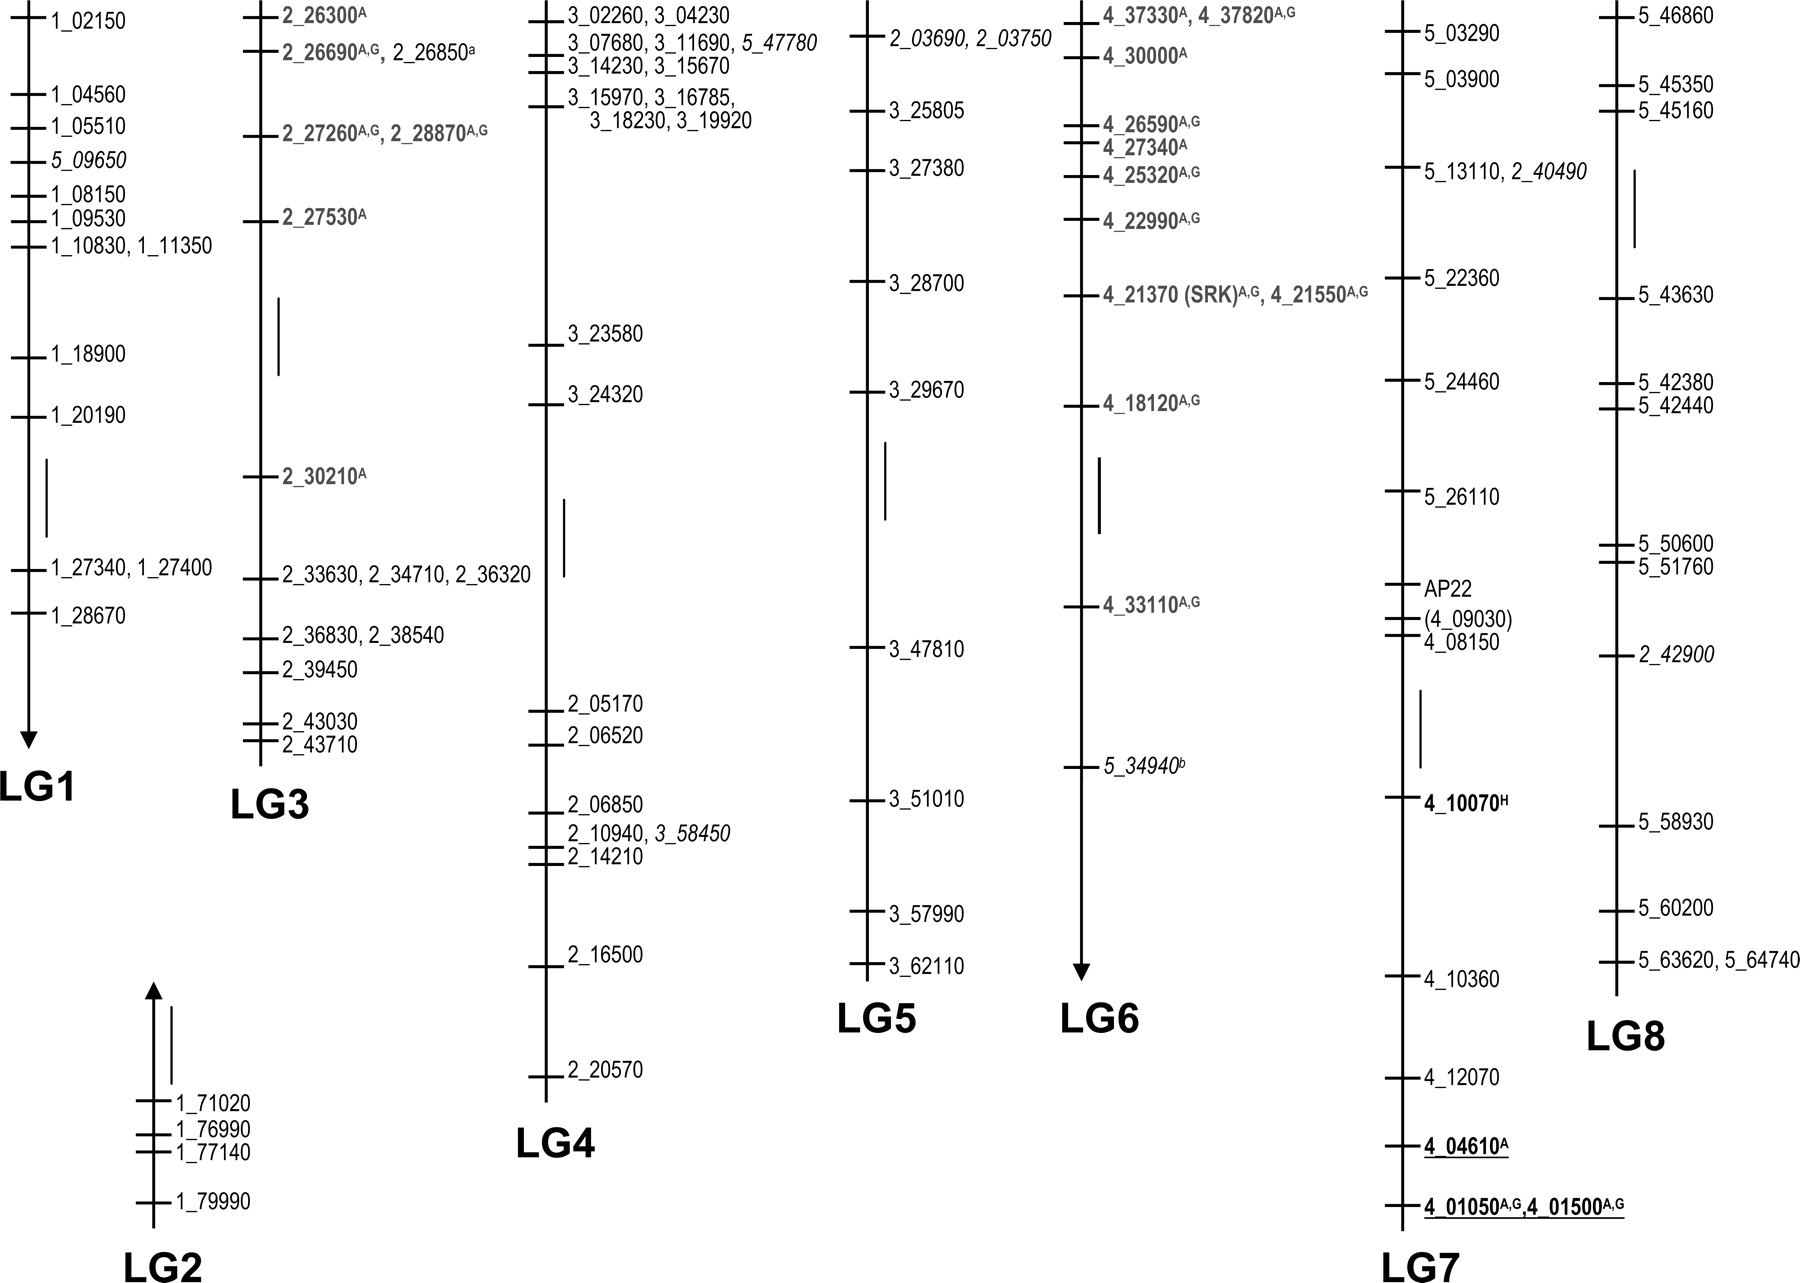
A. l. lyrata linkage map and segregation ratio distortion. The eight linkage groups of A. l. lyrata as resolved by the mapping of 104 markers are numbered LG1–8 at LOD 3 (markers in parentheses have LOD scores just below 3.0). Figure drawn to scale with vertical bars representing 5-cM mapping distance. Marker names signify the gene locus they represent (1_02150 = At1g02150). Italicized markers demonstrate disruption in synteny due to translocation or duplication followed by deletion. Markers in bold demonstrate transmission ratio distortion. Markers in gray show skewed segregation in favor of P1 alleles, and those that are underlined in favor of P2 alleles. A, distortion of allelic ratios; G, distortion of genic ratios; H, distortion ratio overrepresenting heterozygotes and underrepresenting P2 alleles. a, scoring data does not allow clear assessment of segregation ratios; b, allelic ratio nearly significantly skewed in favor of P1 alleles (0.052).


