
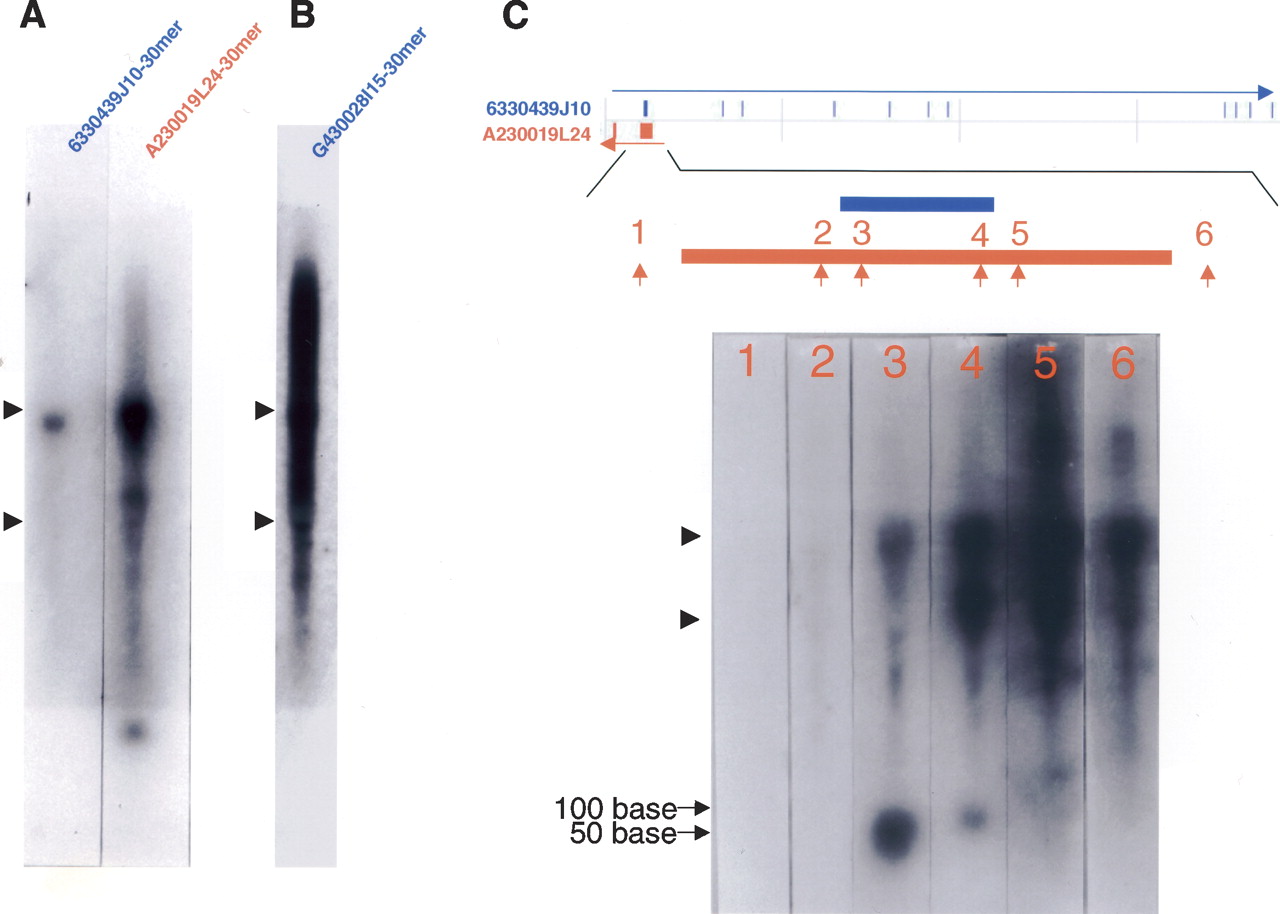
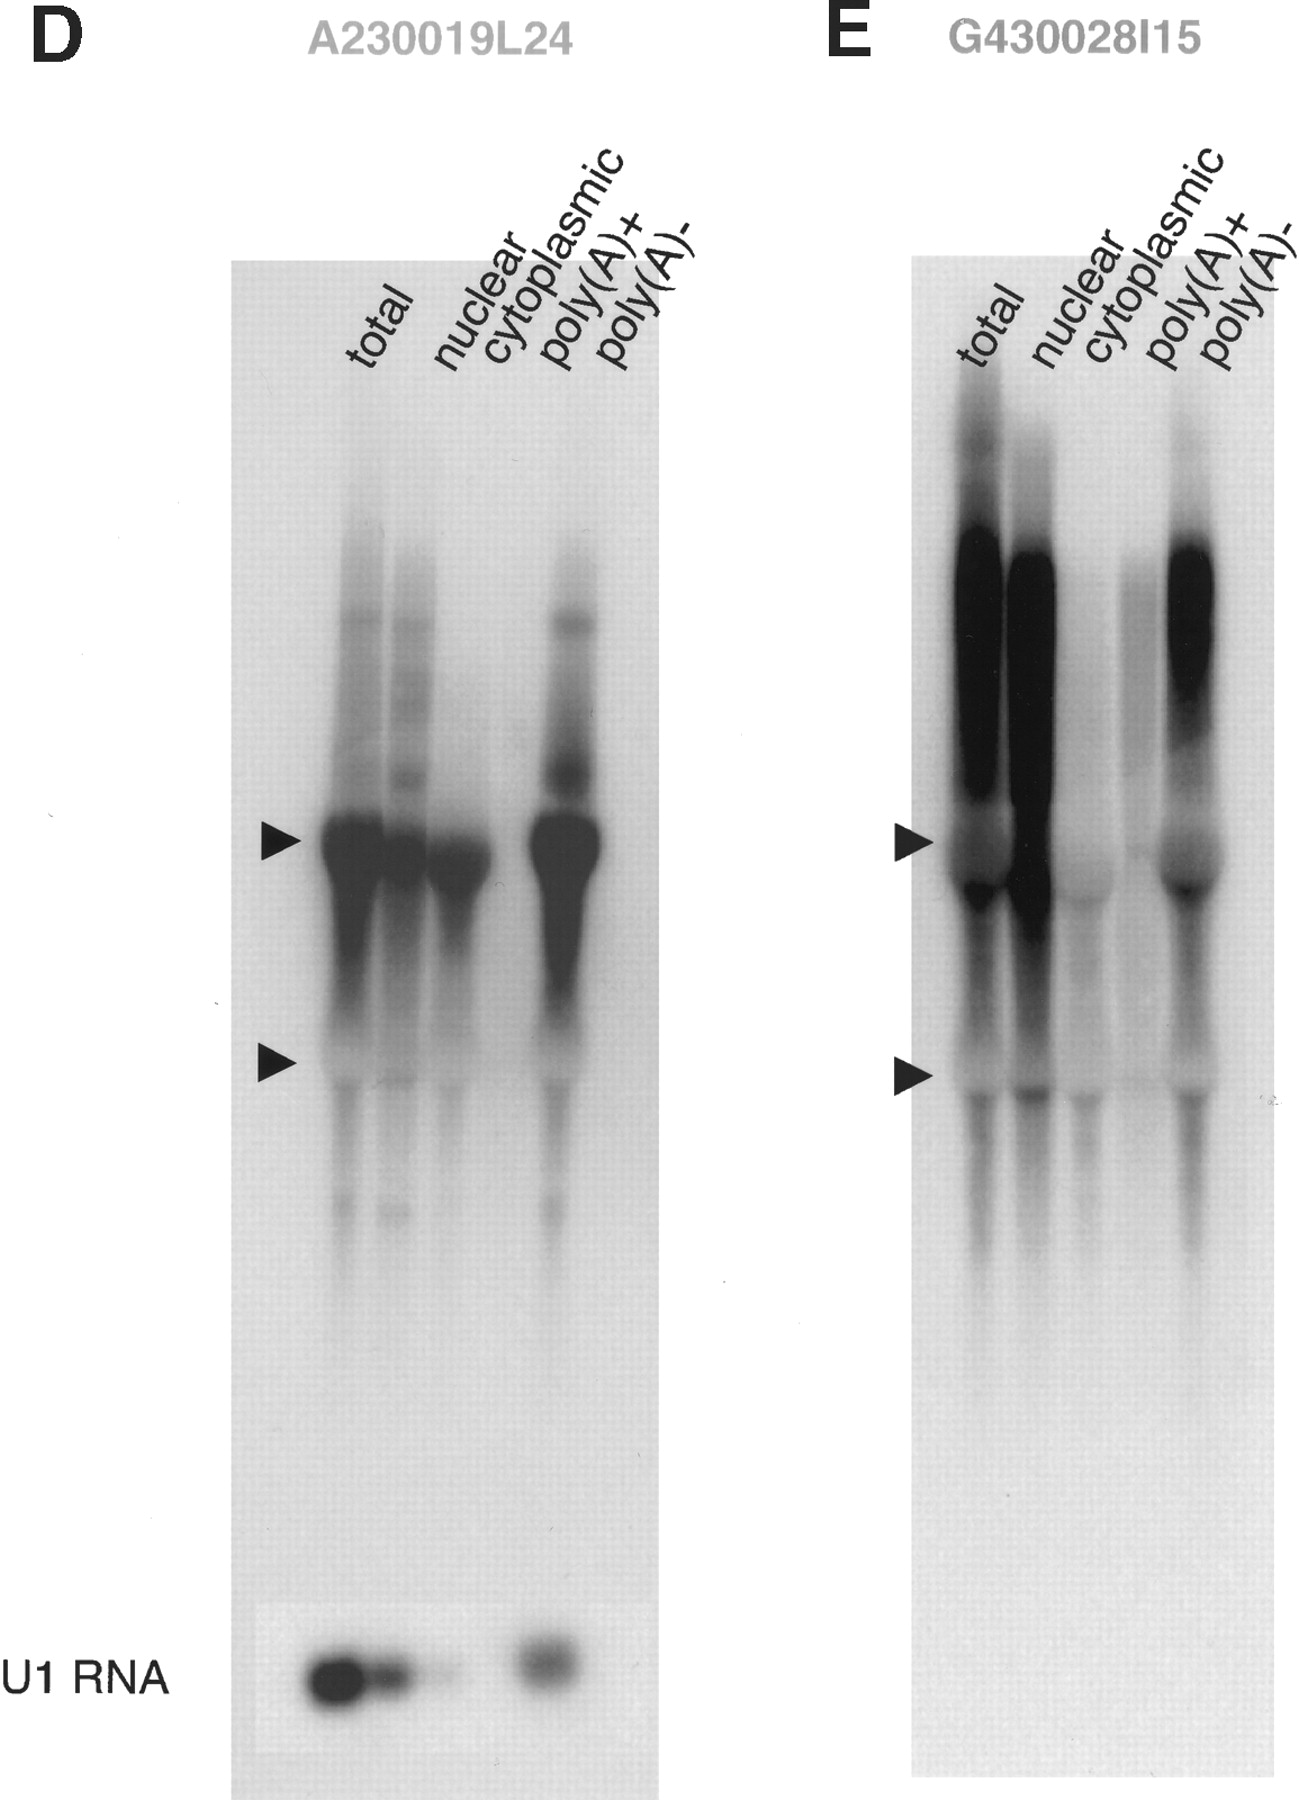
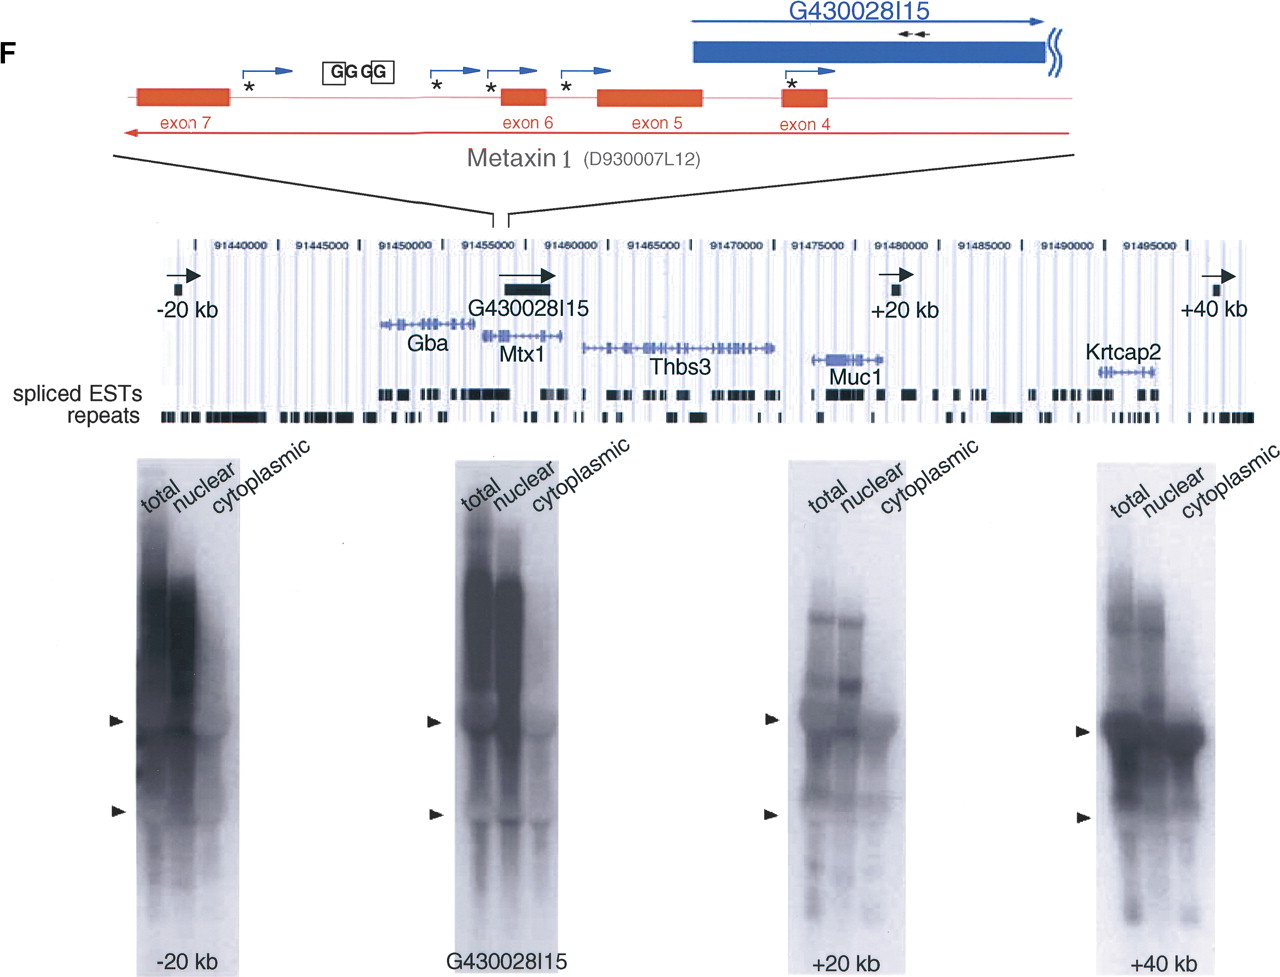
(A,B) Northern hybridization with oligo DNA (30-mer) as a probe. Total RNA (10 μg) from adult mouse brain was loaded in each lane. The 30-mer oligo DNA probes used for 6330439J10 and A230019L24 were exactly complementary to each other. (C) Northern hybridization with a series of 30-mer probes chosen from introns and exons. The mapping pattern of the sense and antisense genes (6330439J10/A230019L24) and expanded map at exons 1 of both genes were diagramed at top. The numbers and arrows in red indicate approximate positions of 30-mer probes selected. Each lane contained 10 μg of total RNA from adult mouse brain. The positions of 18S and 28S ribosomal RNA are indicated by arrowheads at the left edges of the blots. (D,E) Northern hybridization of total (20 μg), nuclear (4 μg), cytoplasmic (16 μg), poly(A)+ (0.5 μg), and poly(A)– (19.5 μg) RNA samples from fibroblast cells with A230019L24 and G430028I15 probes. Each lane contained equivalent amounts of RNA on a per-cell basis. The hybridization to U1 RNA is shown at the bottom of the blot as a control for each fraction of RNA. (F) Overlapping mapping pattern of G430028I15 and D930007L12 (Metaxin1), and the results from 5′ RACE analysis of G430028I15 gene with fibroblast cells are summarized at the top of the figure. The positions of the initial and nested primers for the 5′ RACE analysis are indicated as black arrows above the G430028I15 gene position. The GC boxes identified in the intron of Metaxin1 genes are denoted “G.” The square-boxed G is the one to which Sp1 actually bound (Collins et al. 1998). The transcriptional start sites identified by 5′ RACE analysis are indicated with asterisks and bent arrows. The genomic region from –20 kb to +40 kb of the G430028I15 gene and Northern hybridization with the probes from the –20-, +20-, and +40-kb regions are presented at the bottom of the figure. Total (20 μg), nuclear (4 μg), and cytoplasmic (16 μg) RNA from fibroblast cells were used in each lane. The regions of the probes used for Northern hybridization are shown in the genome map, along with the nearby genes (mouse genome browser at http://genome.ucsc.edu/, October 2003 version).


