
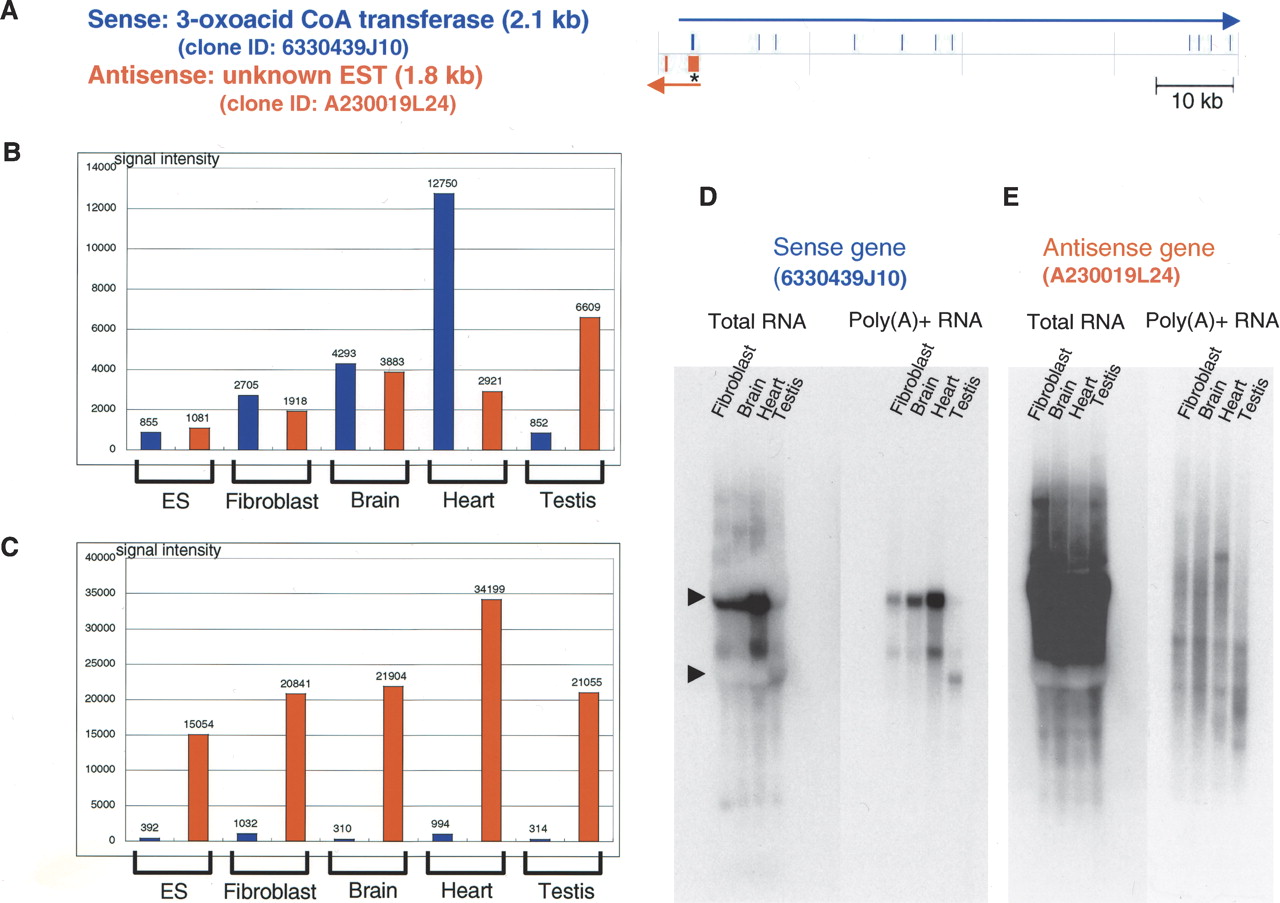
Microarray and Northern hybridization analysis of representative SAT pair. (A) Mapping patterns of sense (coding, 6330439J10) and antisense (noncoding, A230019L24) genes in the genome. The positions of exons are indicated as filled columns. The directions of transcription are indicated with arrows. In this figure, information associated with sense genes is shown in blue and that for antisense genes in red. (B) Microarray signal intensities obtained with samples labeled by oligo dT priming. (C) Microarray signal intensities obtained with samples labeled by random-nanomer priming. (D,E) Northern hybridization of sense (6330439J10) and antisense (A230019L24) genes. In each lane, 20 μg of total RNA or 1 μg of mRNA was loaded. In the Northern blot figures, the positions of 18S and 28S ribosomal RNA are indicated by arrowheads at the left edges of the blots.


