
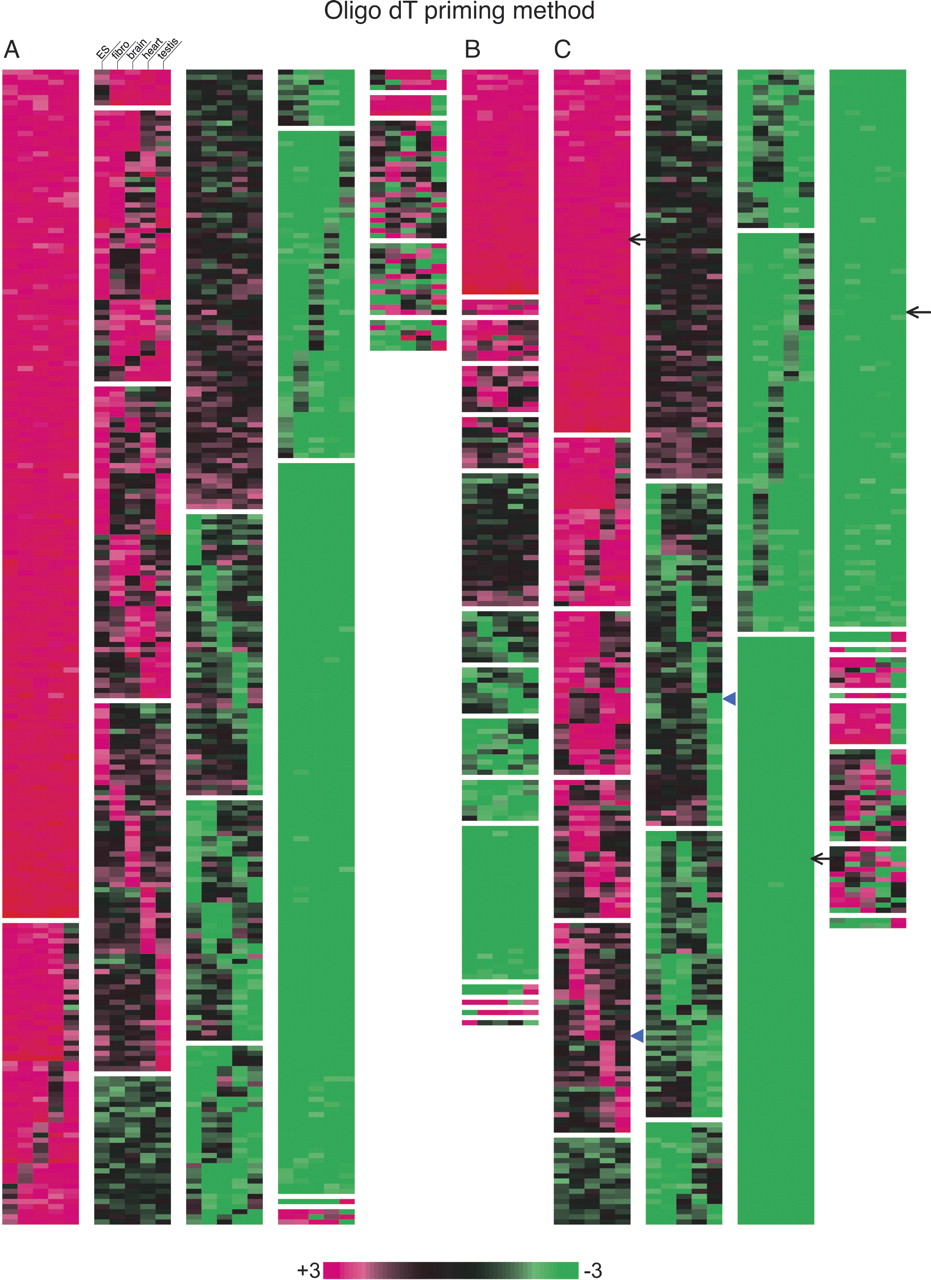
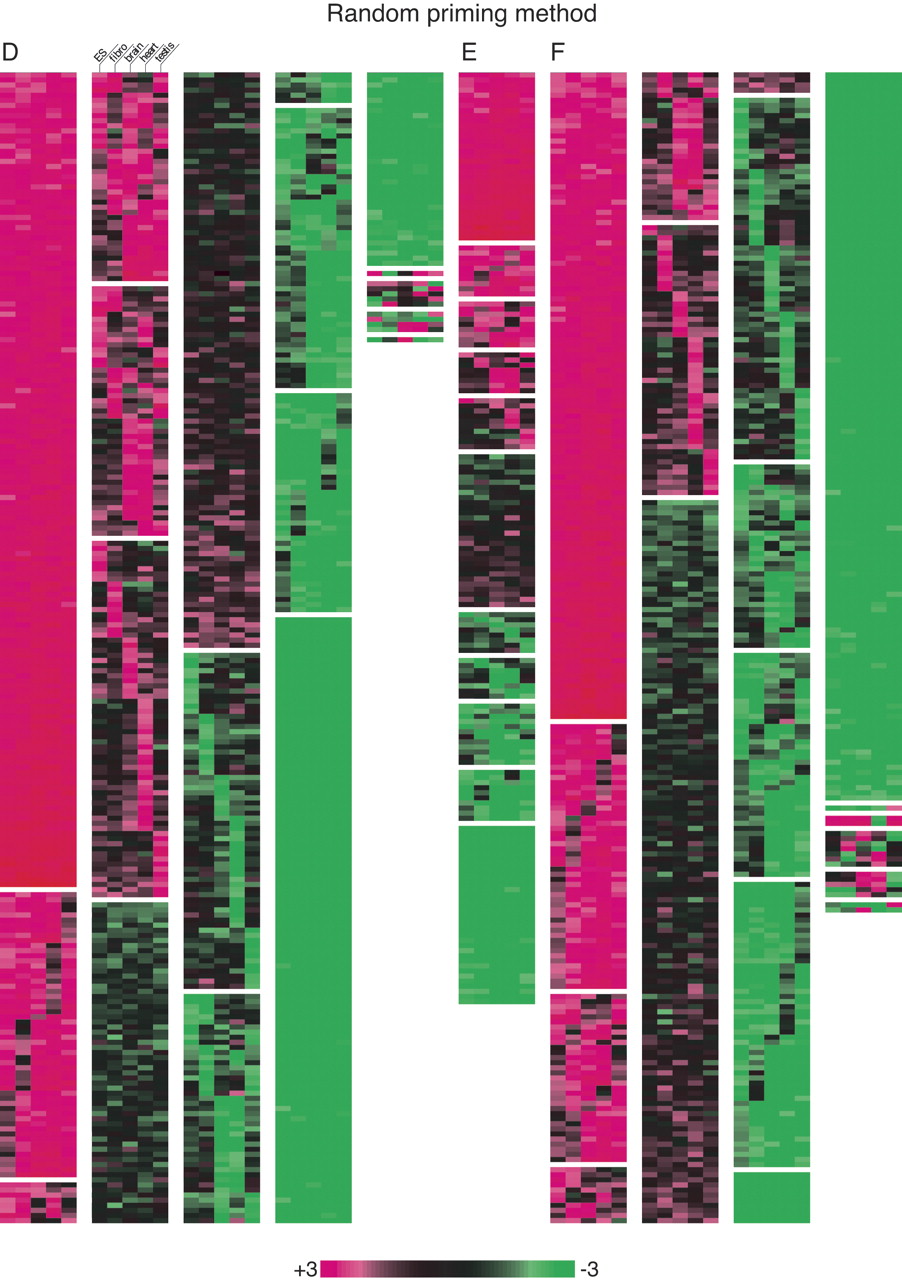
Clustering analysis of the expression balance between the sense and antisense genes, or the coding and noncoding genes in ES cells, fibroblast cells, brain, heart, and testis. A, B, C was based on the microarray data obtained with the oligo dT priming method, whereas the random priming method was used for the data in D, E, and F. (A,D) Clustering with the data of the pairs consisting of the coding genes only. When the sense gene expression is threefold more than the antisense gene expression, the color is shown in red. In the reversed situation, the color is shown in green. (B,E) Clustering with the data of the pairs consisting of the noncoding genes only. The coloring is the same as found in A. (C,F) Clustering with the data of the pairs consisting of the coding and noncoding genes. When the noncoding gene expression is threefold more than the coding gene expression, the color is shown in red. Note that this figure is intended to show the ratio between sense and antisense, or noncoding and coding expression. The absolute expression values for each gene are found in Supplemental Table 1.


