
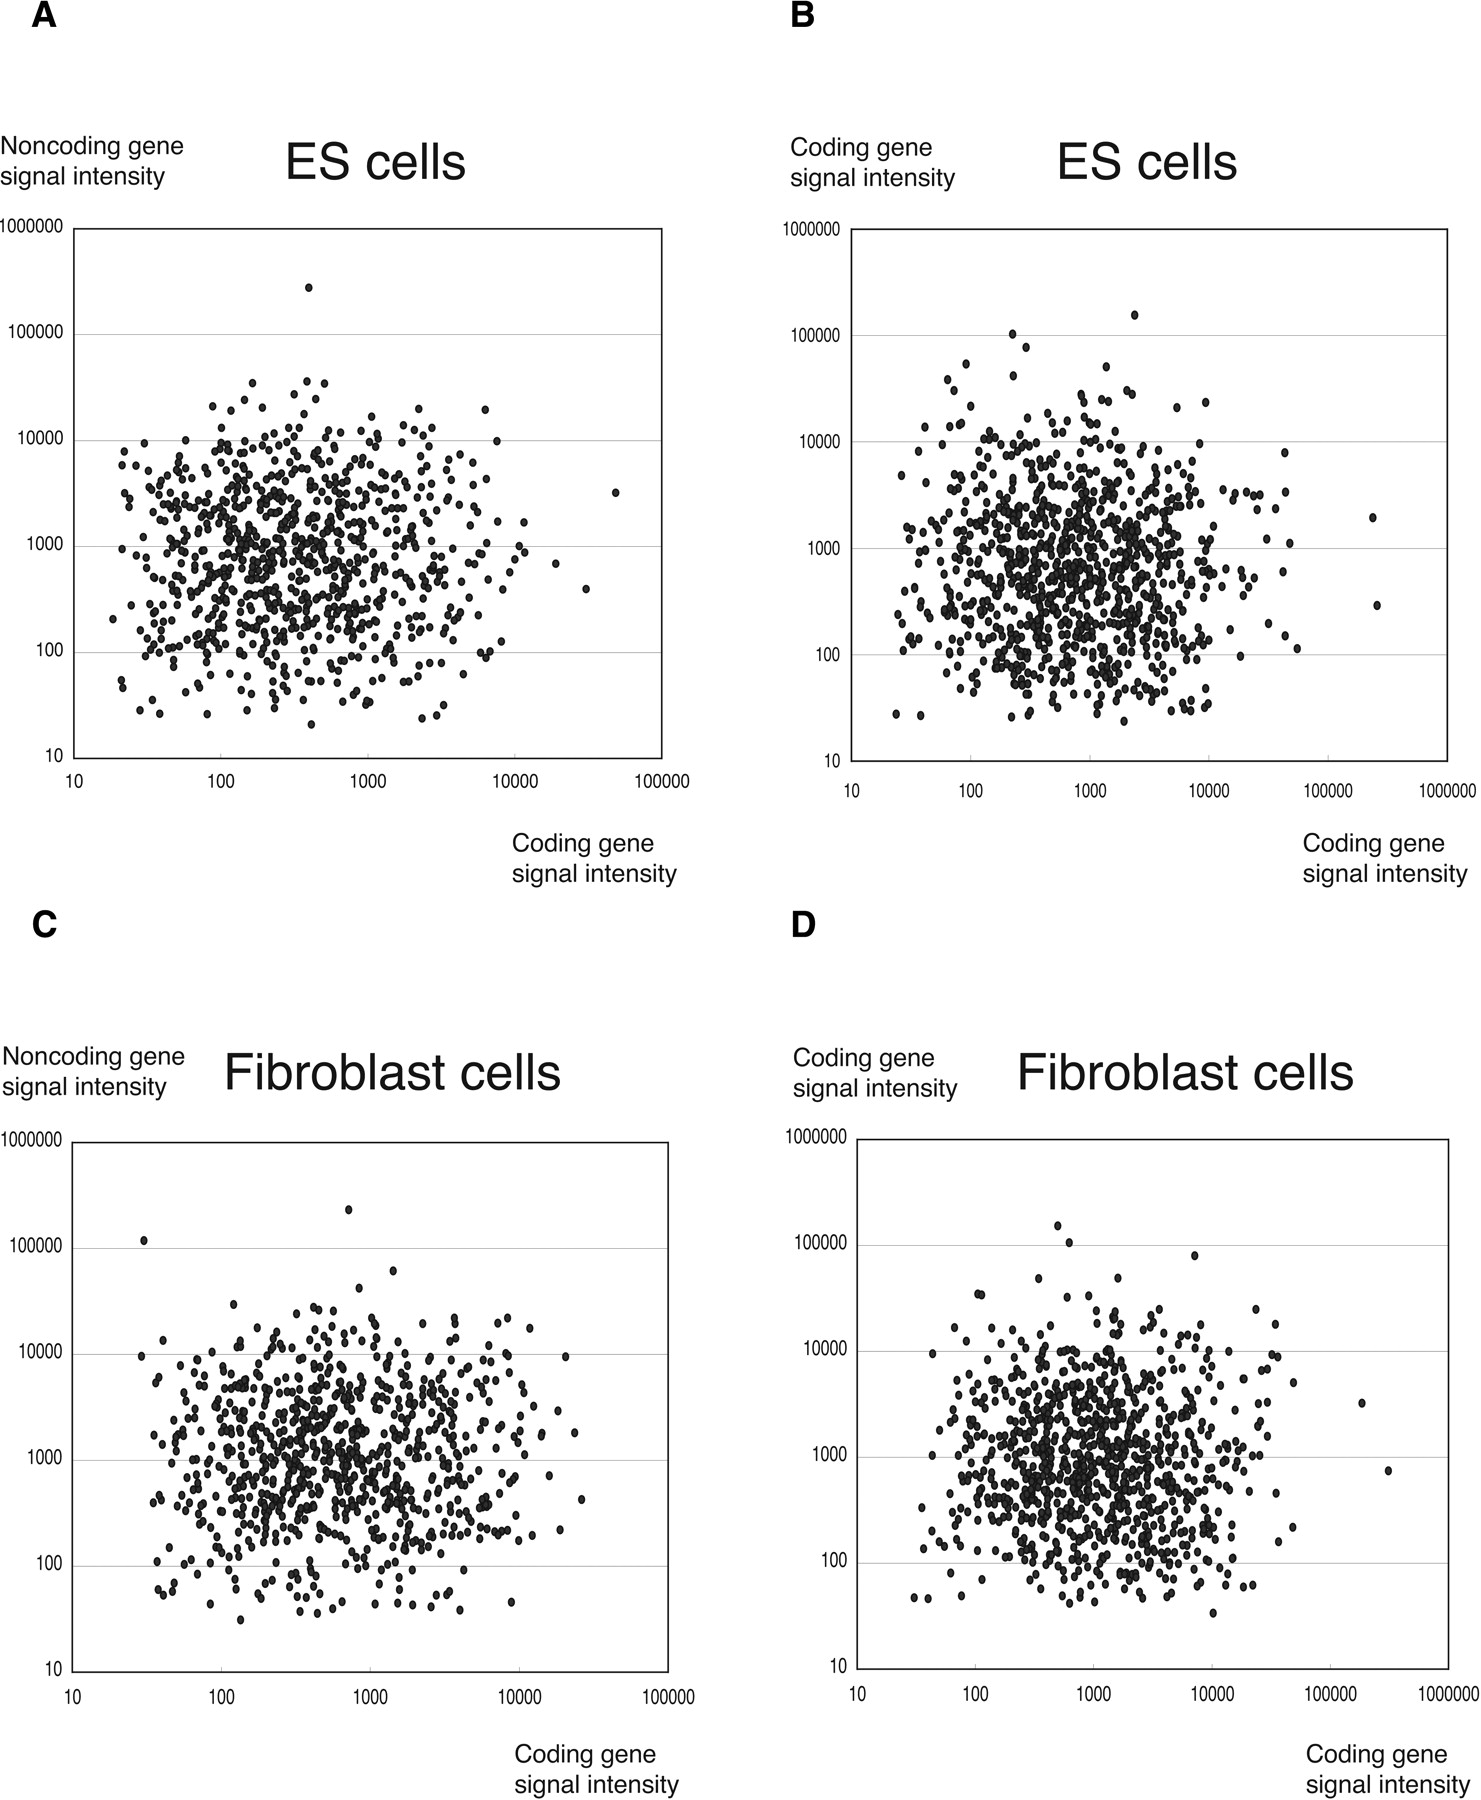
Figure 1.
Overall expression of sense and antisense genes as determined by using an oligo DNA microarray. The combined expression of one SAT pair is represented by a dot. The expression in ES cells is presented in A and B, and that in fibroblast cells is presented in C and D. The pairs consisting of coding and noncoding genes are shown in A and C (x-axis, noncoding gene; y-axis, coding gene), whereas the pairs consisting of both coding genes are shown in B and D.


