
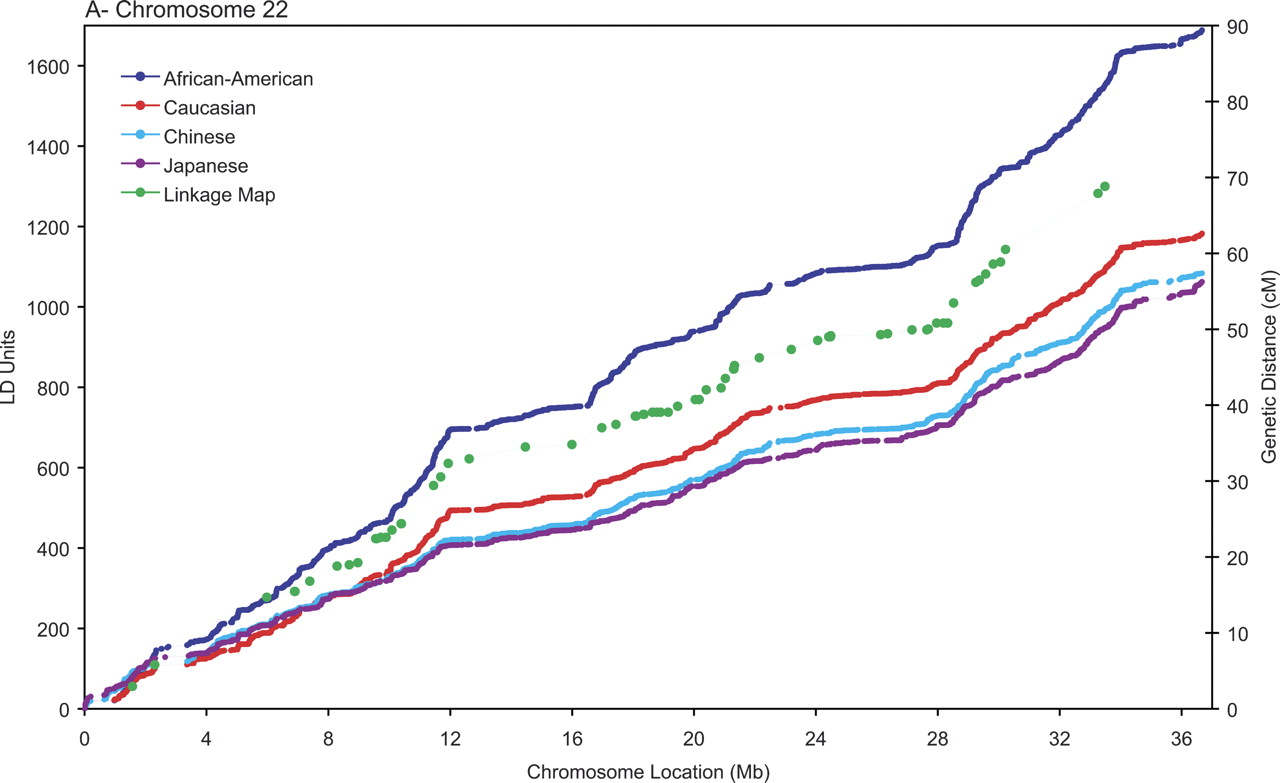
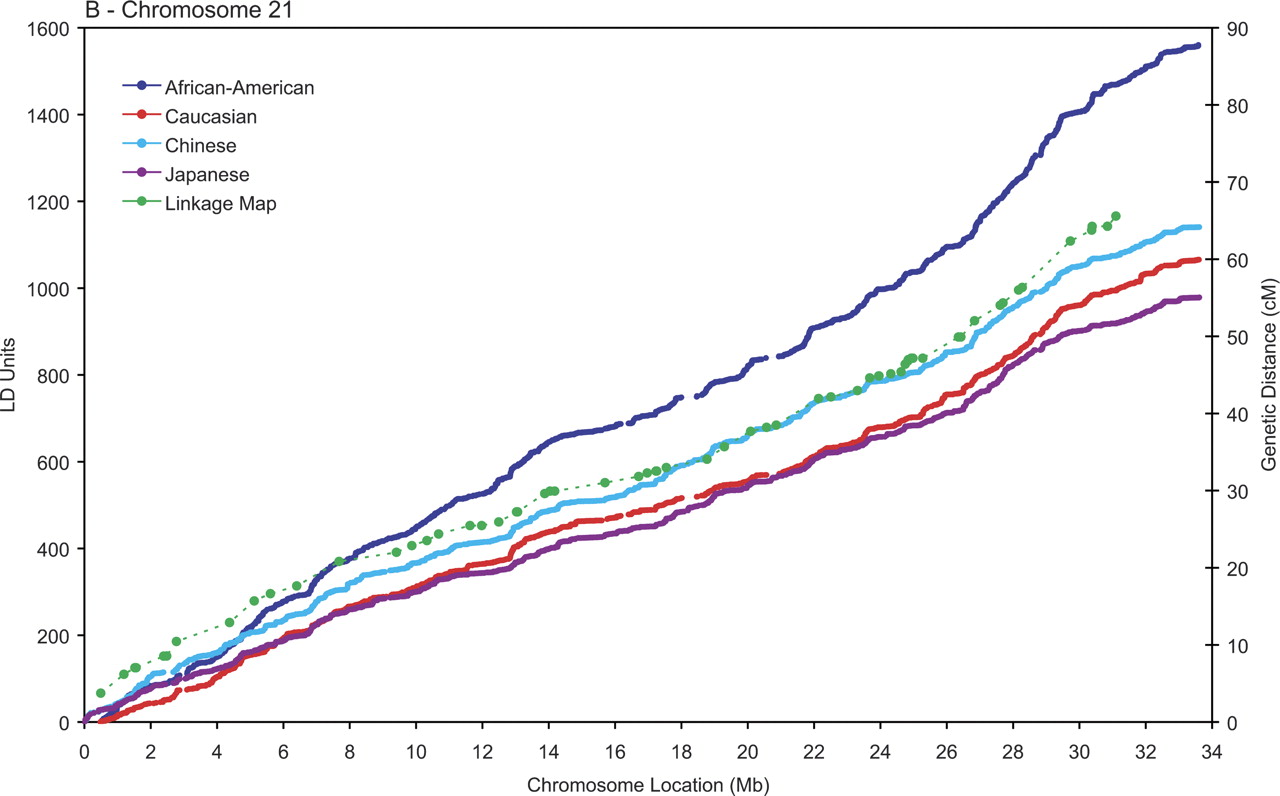
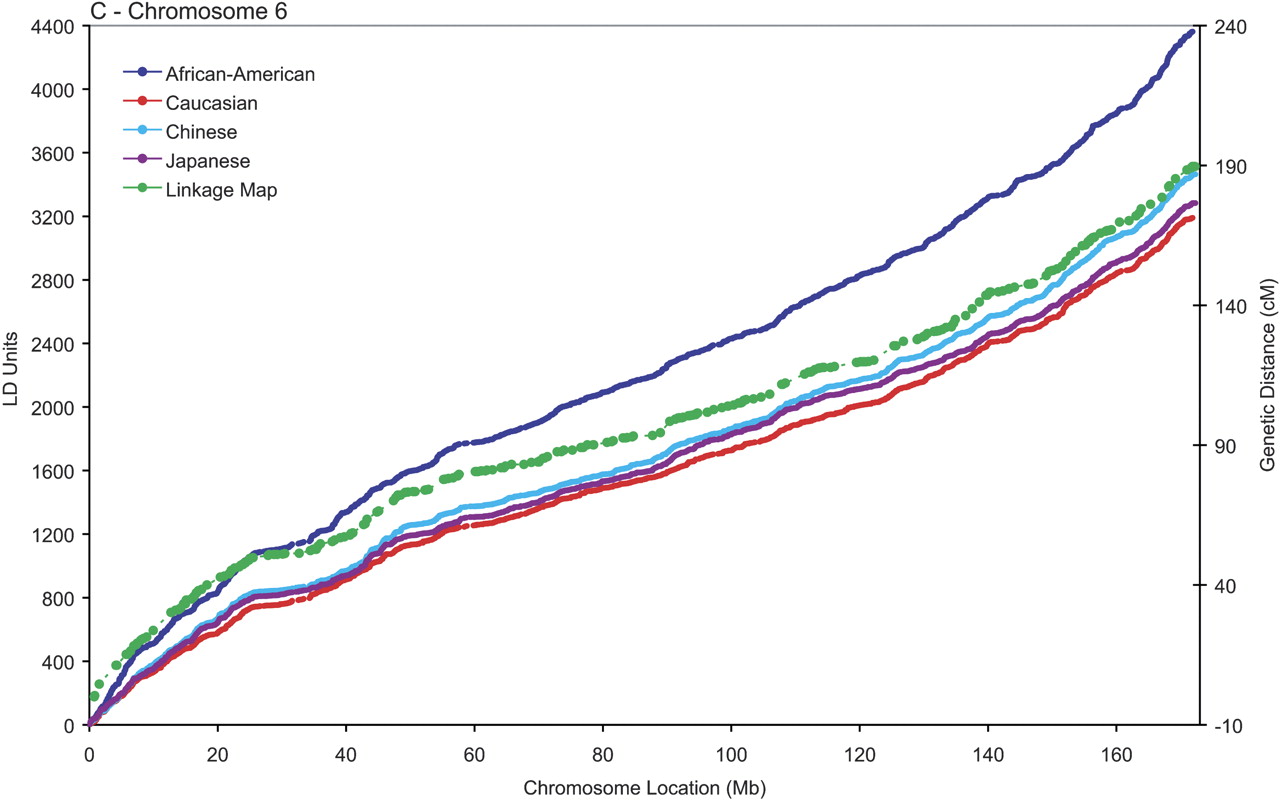
Figure 1.
Population-specific metric LD maps of the three chromosomes. (A) Chromosome 22; (B) chromosome 21; (C) chromosome 6. SNP locations in LDUs (left vertical axis) and physical coordinates in Mb (horizontal axis) for African-American (blue); Caucasians (red); Chinese (turquoise); Japanese (purple). The location of the markers' part of the high-resolution linkage map of Kong et al. (2002) in the physical and the genetic maps is shown in green (cM scale, right vertical axis).


