
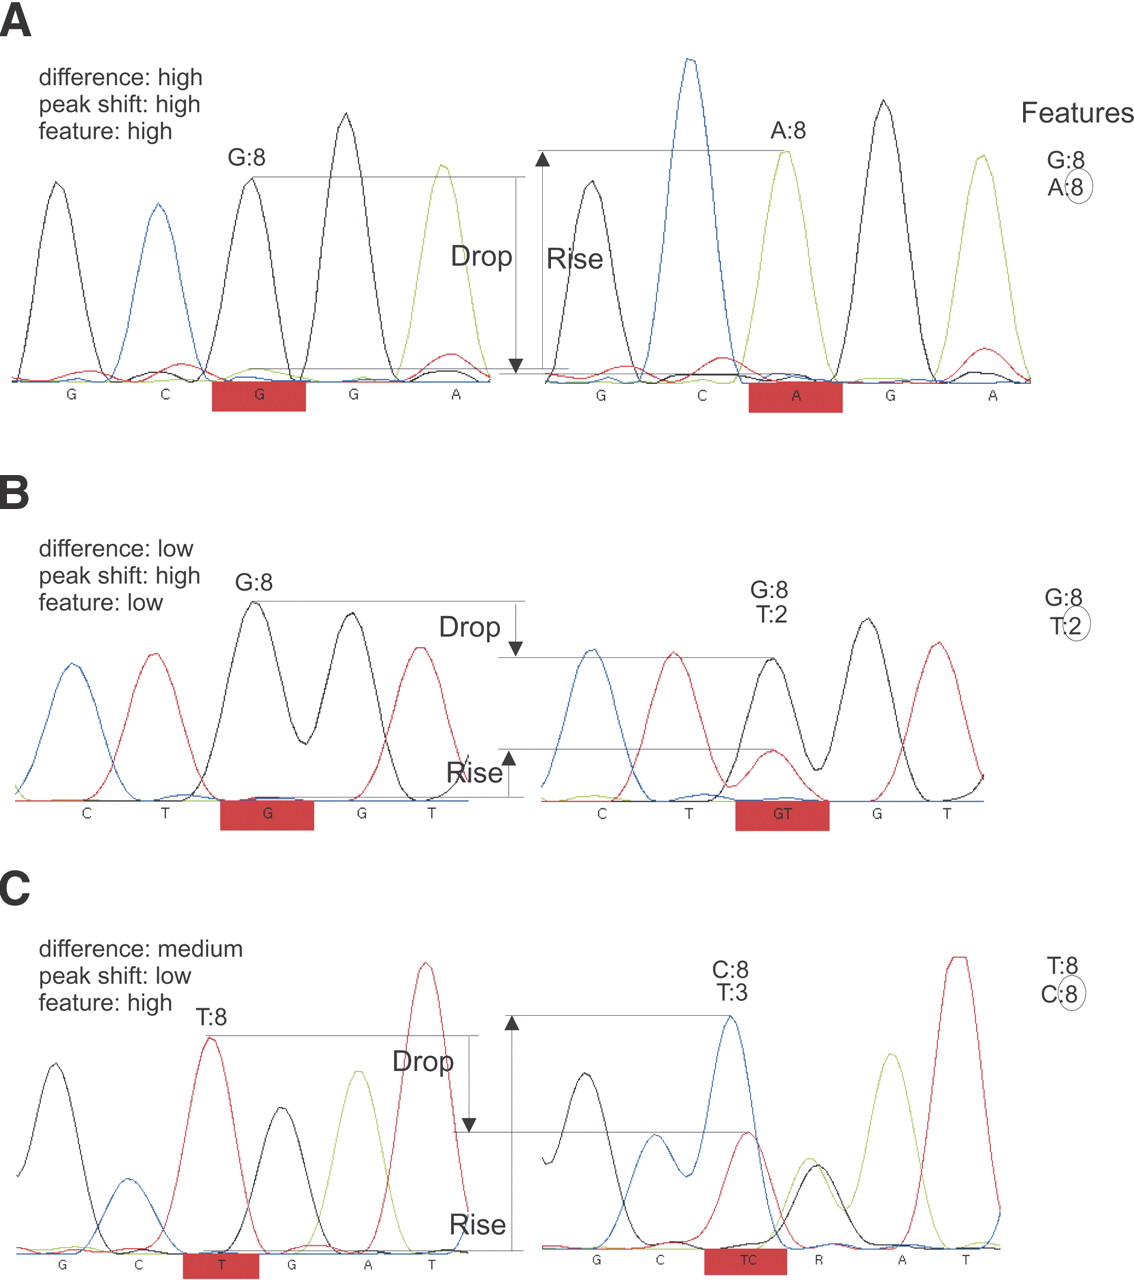
Illustration of the metrics used to calculate the novoSNP quality scores. (A) An easy to detect, homozygous SNP that scores high for all metrics. The features seen in the traces and their scores are listed on the right; the second best score (circled) represents the feature score for this position. (B) An example showing a relative small difference in peak area resulting in a low distance metric. The feature metric assigns a low score to the small secondary peak in the heterozygous sample. However, the compensation in the differences in peak area usually seen in true SNPs and measured by the peak shift metric is very clear: The drop in size in one color is almost just as large as the rise of the other color. (C) The peak shift is not always clearly present. In this example, the differences in peak size are large, but their absolute values not similar. The SNP will still be picked up by the other metrics.


