
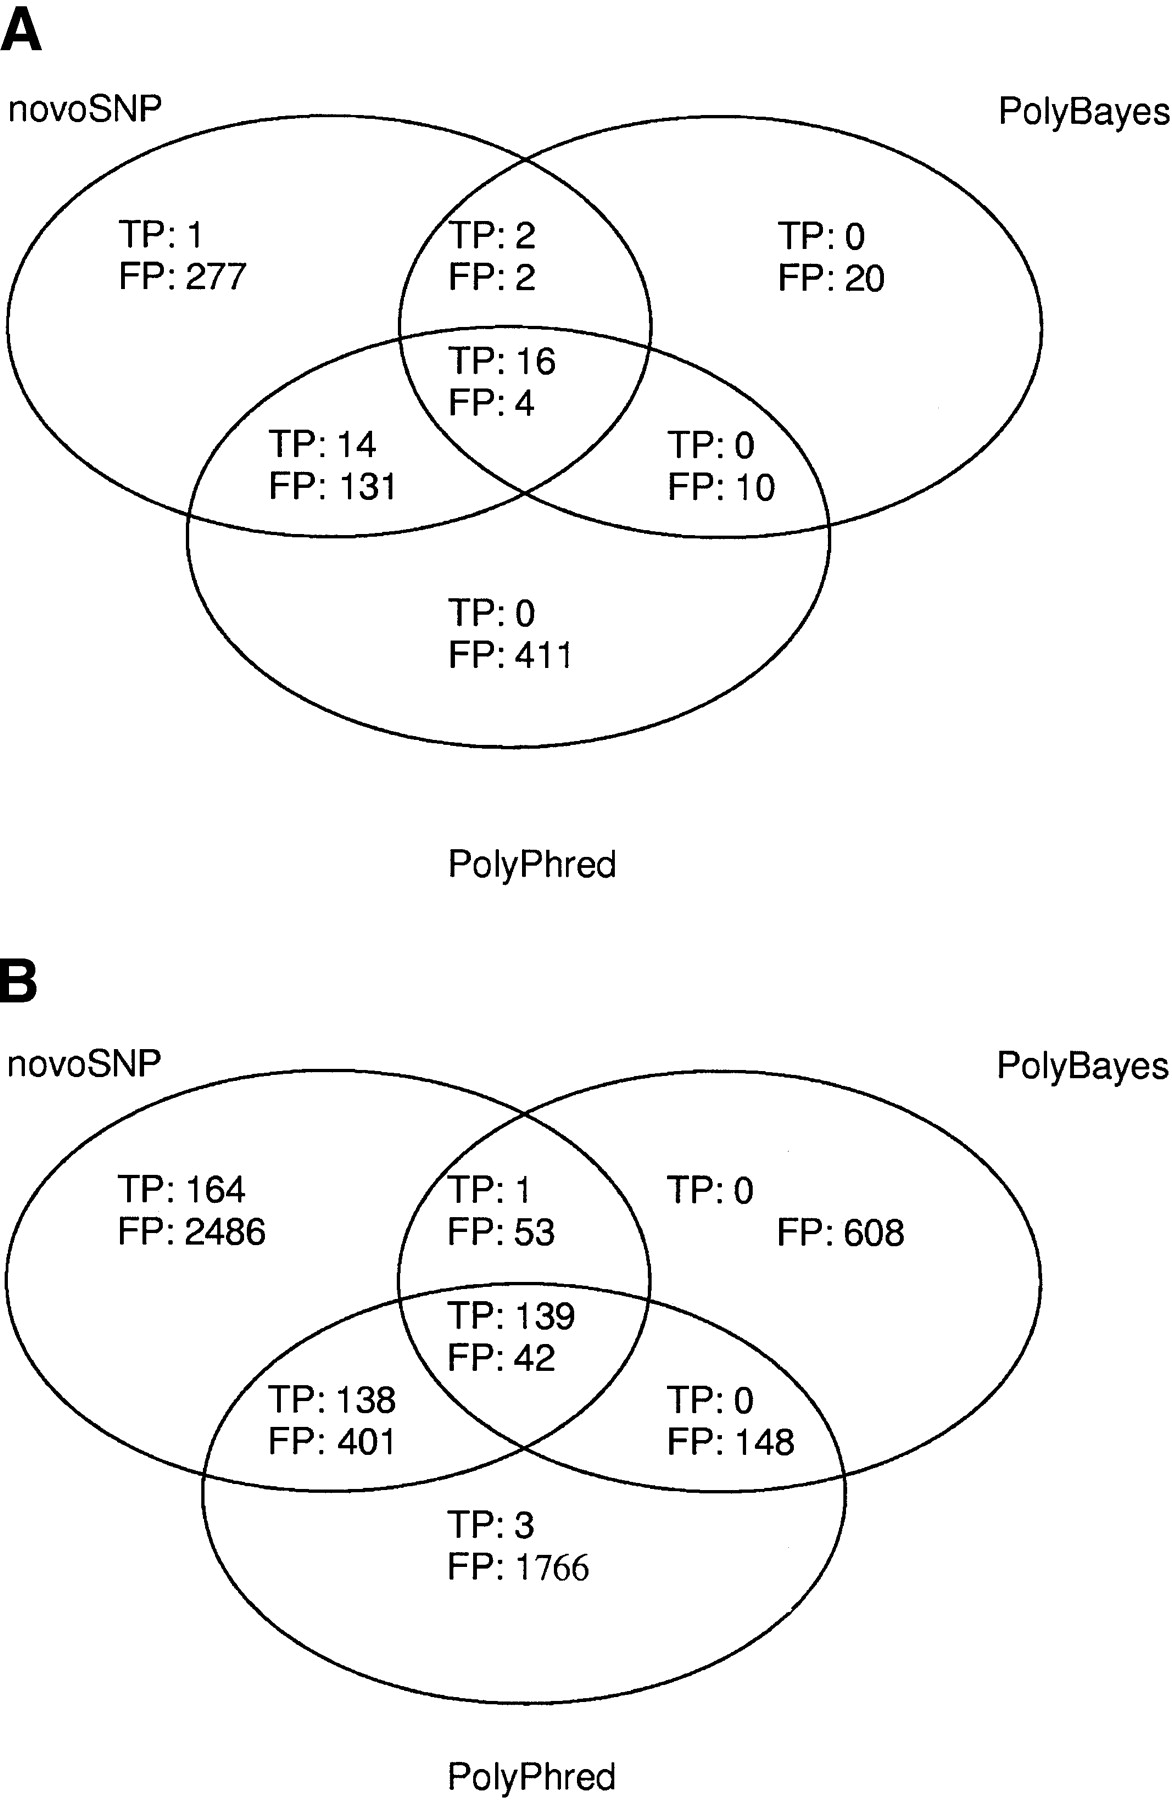
Figure 2.
Venn diagrams representing the results of novoSNP, PolyPhred, and PolyBayes and their respective overlaps. The numbers represent the amount of true (TP) and false-positive (FP) SNPs detected by each program, regardless of their quality scores. (A) The SCN1A data. (B) The MAPT data.


