
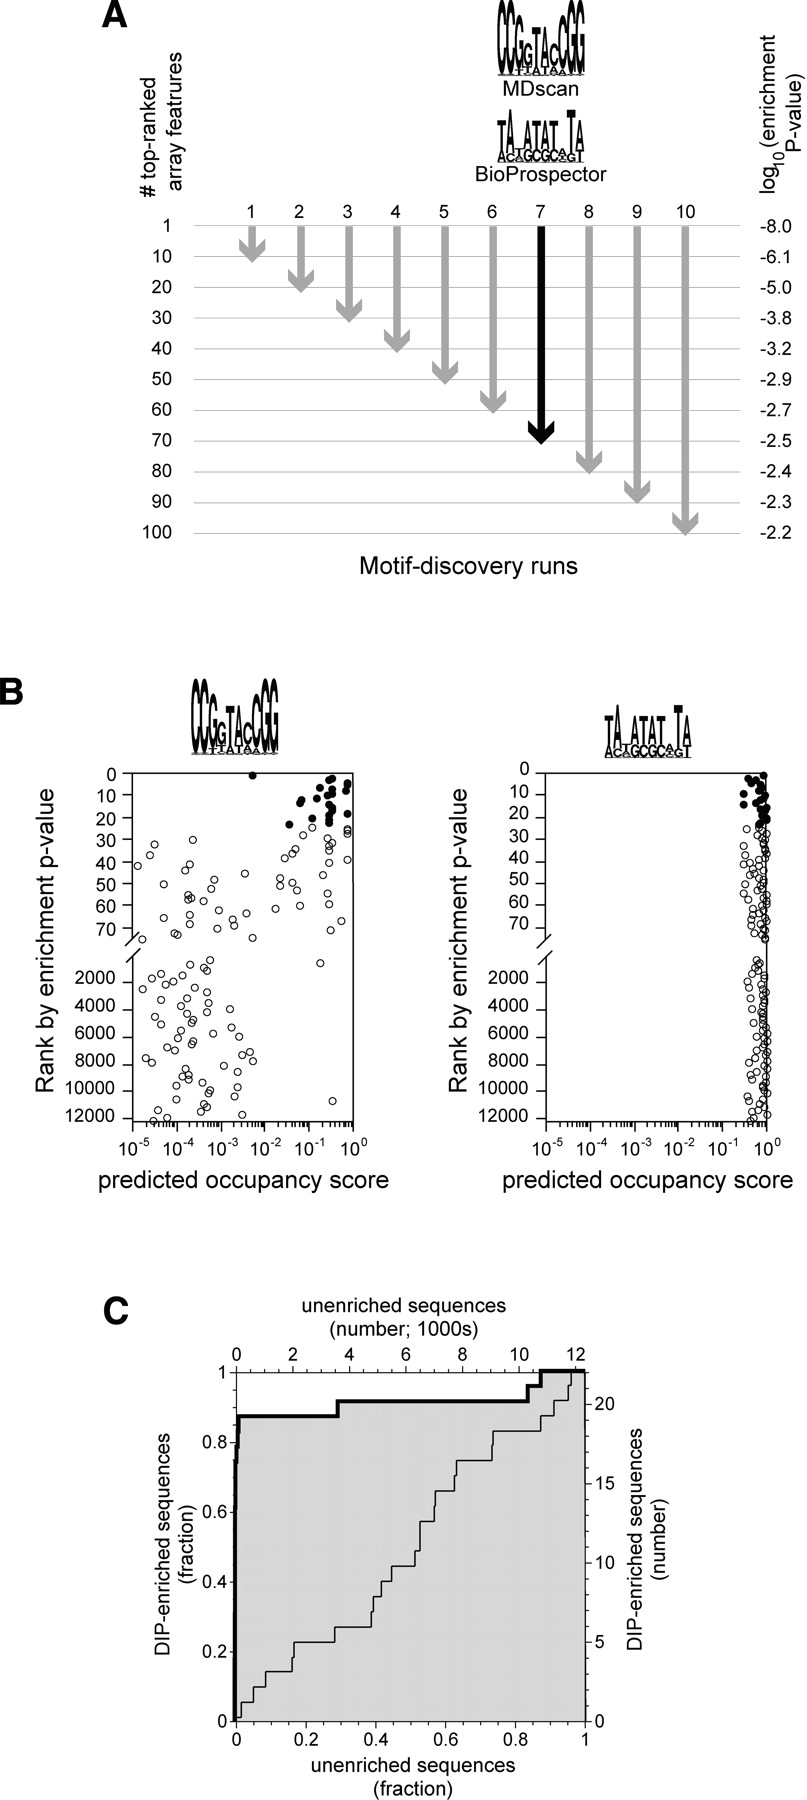
Motif discovery procedure. (A) For each of the two protein concentrations used, array features were ranked according to enrichment p-value. The sequences corresponding to the top 10, 20, 30,..., 100 features were used as input to BioProspector and MDscan. For each set of features, indicated by arrows, a single position weight matrix (PWM) was obtained from each of the two programs. For illustrative purposes, we show the two motifs discovered using the top 70 features from the 4-nM experiment (black arrow). This set is interesting because it provides a contrast between an excellent PWM (MDscan) and a poor one (Bioprospector, see B and C). Motifs are represented as sequence logos with the height of each column representing the information content of that position in the binding site (Schneider and Stephens 1990). (B) Computationally defined occupancy scores for the top 75 enriched array features and for every 200th feature thereafter (4-nM experiment; note the break in the y-axis and the change in scale). Occupancy scores were calculated using the two PWMs shown in A (Methods). Filled circles represent the 23 features that meet the 1% false discovery rate criterion for significance; all other features are shown as open circles. Only the PWM defined by MDscan (consensus sequence CCGGTACCGG) shows a marked tendency for the DIP-enriched sequences to have higher occupancy scores than the nonenriched sequences. (C) A Receiver Operator Characteristic (ROC) curve (Hanley and McNeil 1982) showing the power of a PWM to distinguish DIP-enriched sequences from nonenriched. The heavy line with the shaded area below is for the PWM defined by MDscan in A, while the light line is for the PWM defined by BioProspector. The curves are equivalent to a plot of the true positives vs. false positives for all possible values of the occupancy scores that, for a given PWM, would be used to predict enrichment (see text). Each of the 20 PWMs discovered at each protein concentration was judged based on the area under the ROC curve (ROC AUC) obtained using occupancy scores calculated with that PWM. A ROC AUC value of 0.5, corresponding to a diagonal ROC curve, is expected by chance, while a value of 1.0 indicates perfect predictive value for the motif. In this case, the BioProspector-defined motif shows no predictive power (ROC AUC = 0.49), while the MDscan motif does (ROC AUC = 0.91). Note that the ability of MDscan to outperform Bioprospector is specific to this example and does not occur in every case.


