
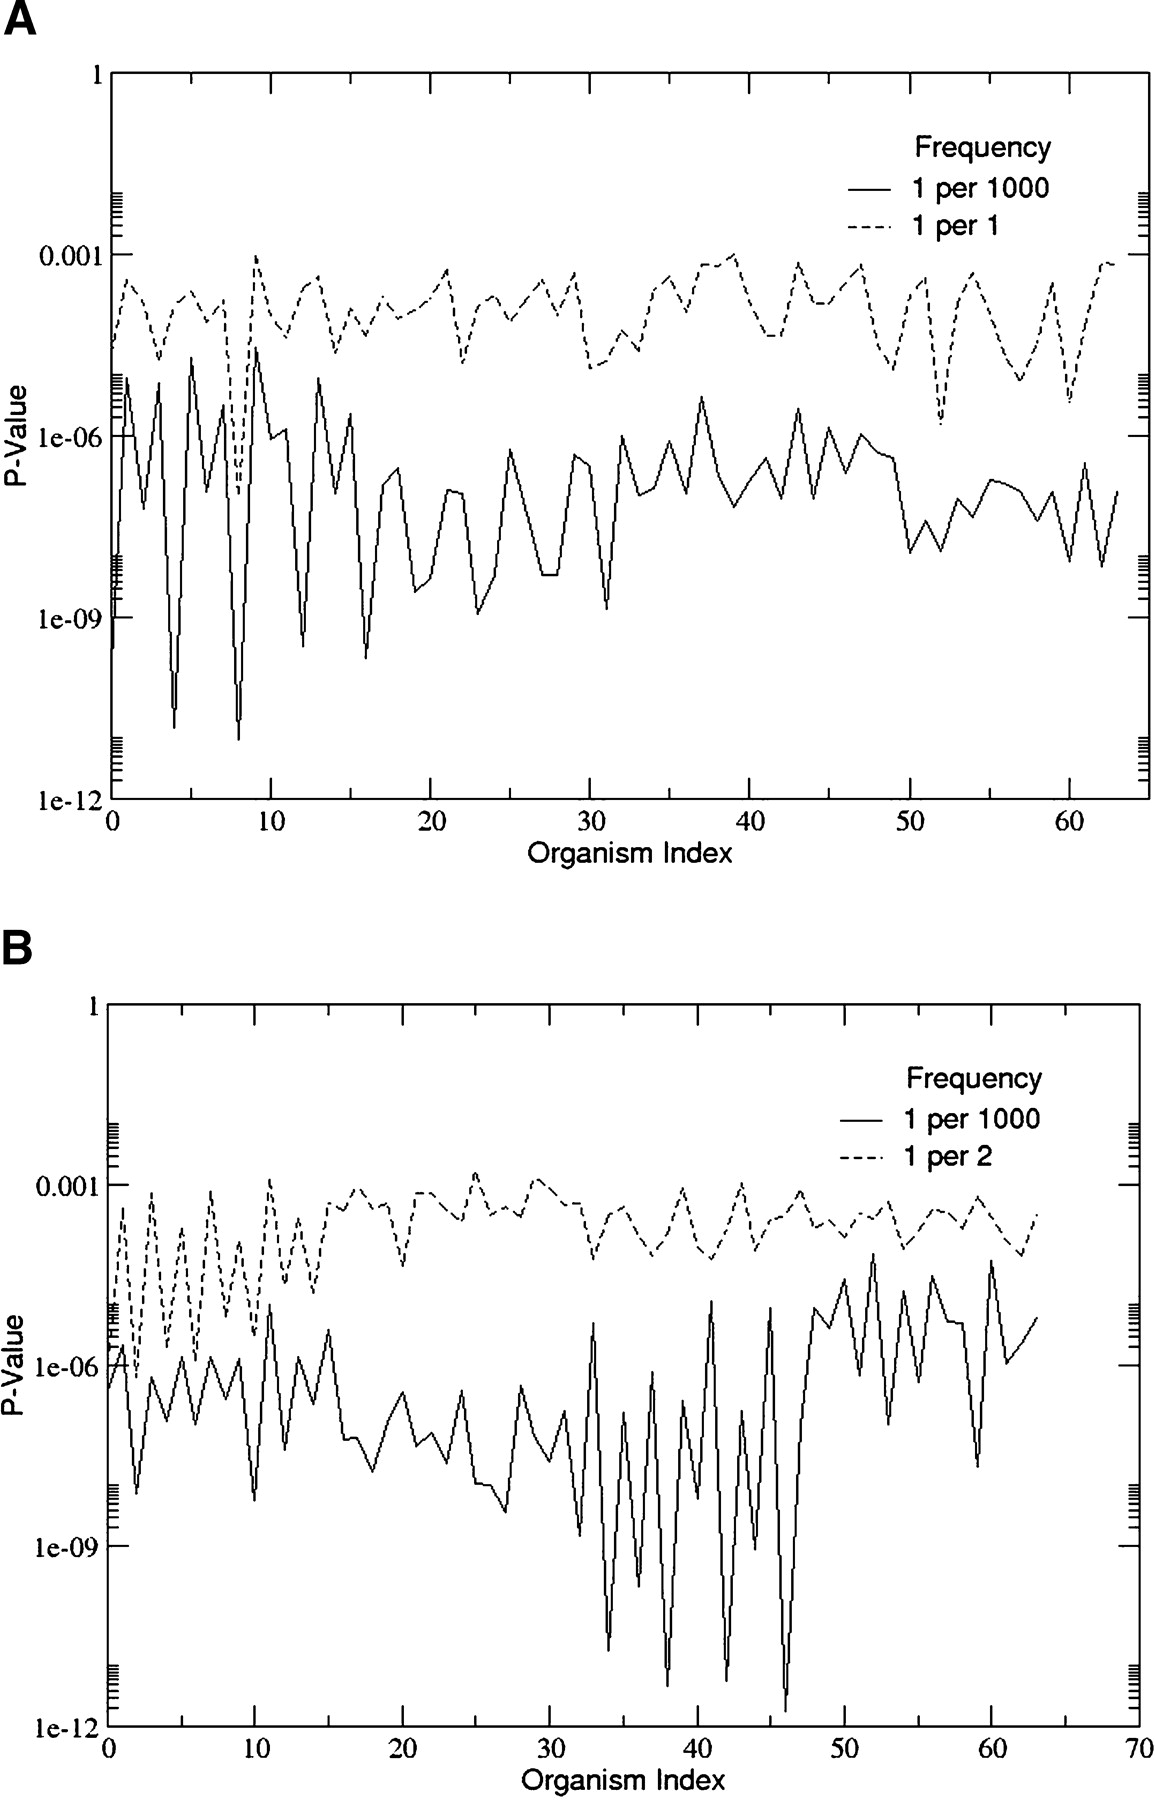
LGT and the randomness of structural proteomes. (A) The P-values of model proteomes created in eight independent runs with two different LSDT frequencies are displayed above. The legends “1 per 1000” and “1 per 1” indicate LSDT frequencies of 1 per every 1000 domain discovery event and 1 per every domain discovery event, respectively. In most cases, the P-values of organisms evolved at higher LSDT frequencies are significantly higher than those evolved at lower frequencies. (B) A plot similar to that in A, but involving an LSDT model in which LSDT may only occur between closely related organisms. As with the model in A, LGT tends to increase the probability that a model organismal subgraph will be a random subgraph of the model PDUG.


