
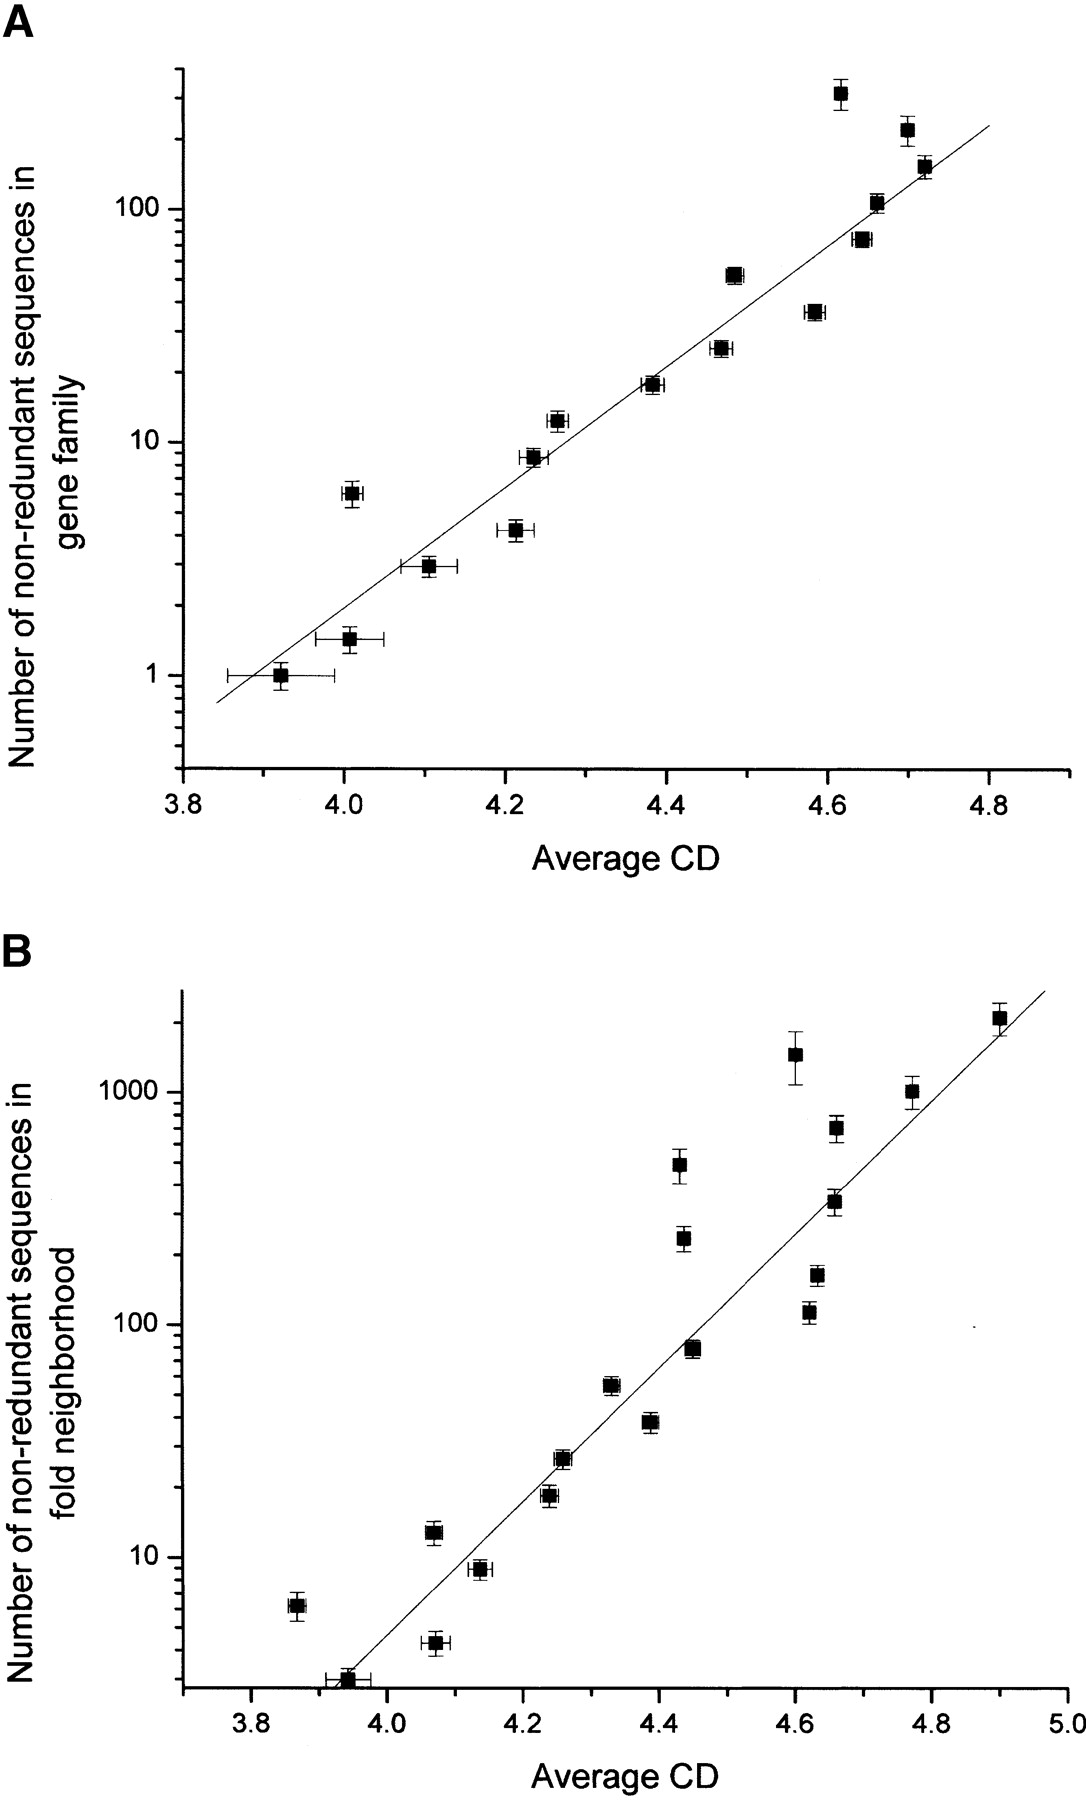
(A) The plot of the logarithm of average gene family size vs. the structural contact density parameter calculated for the structures encoded by these sequences (as explained in Methods). Each point represents a bin in log (gene family size), with a step size of ∼0.35. Each bin contains 100-250 families. Binning in (log) of gene family sizes provides the advantage of having an approximately equal number of gene families in each bin. The statistical correlation of the linear fit is R = 0.95 with P < 0.001. The error bars on the CD axis represent the average deviation of CD inside each gene family averaged for all families belonging to the bin (see Methods). The error bars on the vertical axis correspond to the deviation of the mean number of members for each gene family inside the bin. (B) The correlation between the average CD of the structural neighborhood as defined on the PDUG (Fig. 1) and the log of the family sizes of all the sequences inside that neighborhood. Here, R = 0.95 with P < 0.001. The error bars are calculated as described for A.


