
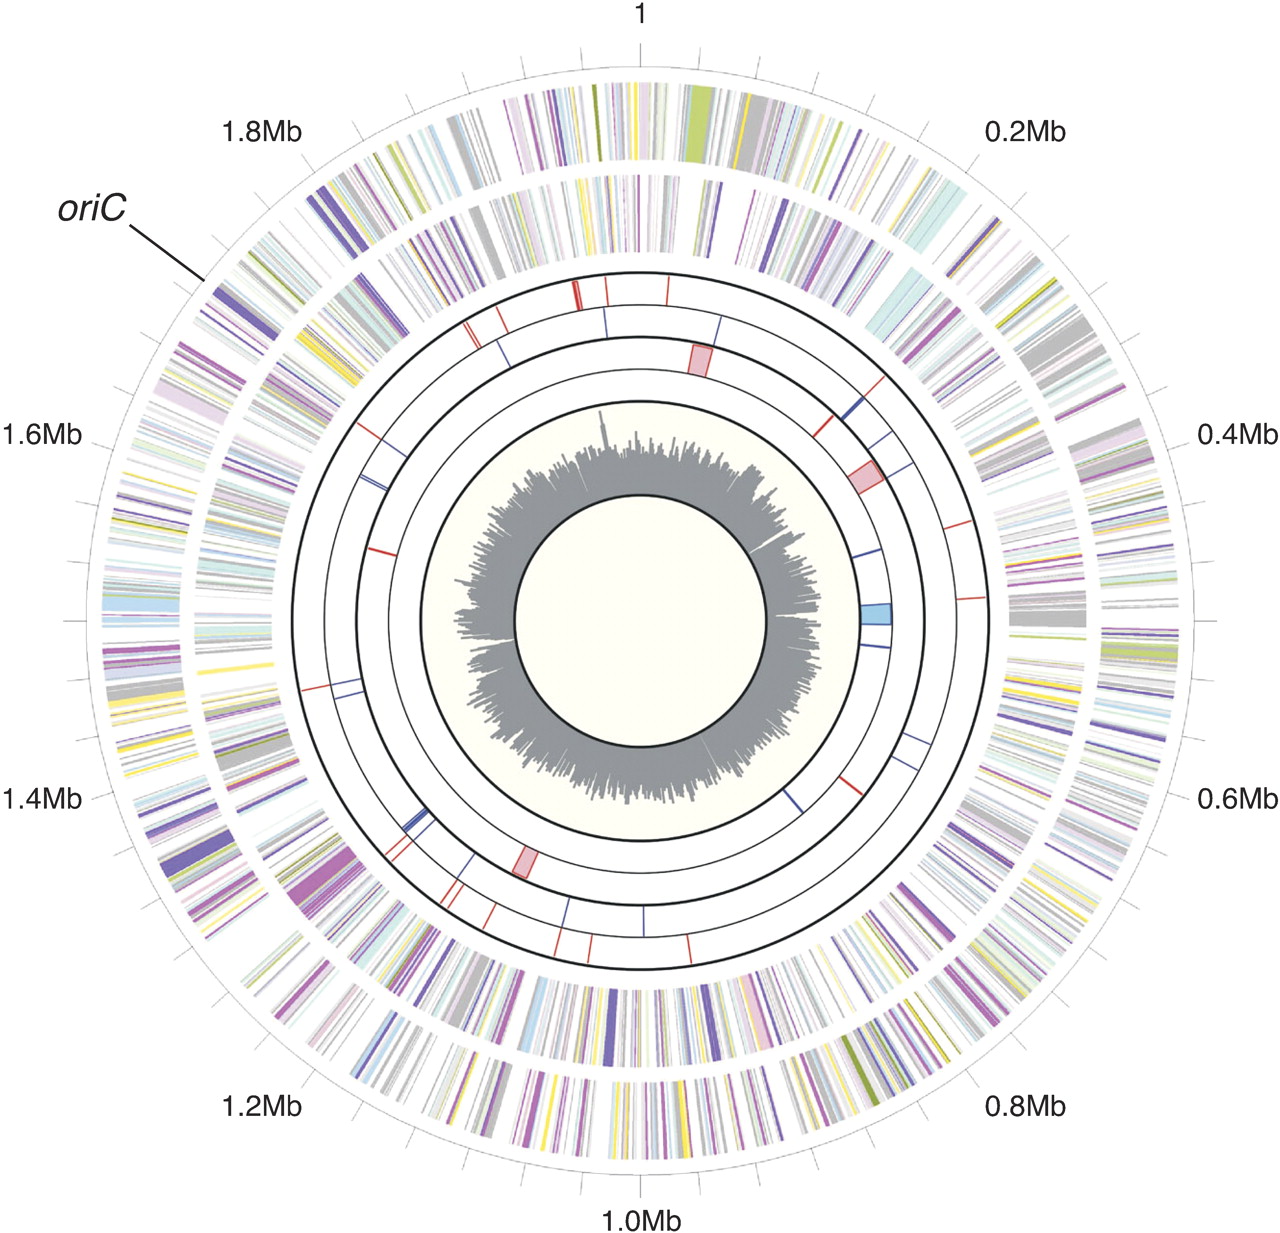
Circular representation of the T. kodakaraensis genome. Circles, from outer to inner, display (1) Physical map scaled in megabases from base 1 (outermost circle). The putative replication origin (oriC) was predicted from comparison with the P. abyssi genome. (2) Predicted protein-coding regions in the clockwise direction (the second circle) and in the counterclockwise direction (the third circle), respectively. The displayed genes are color-coded according to the functional classification: (magenta) translation/ribosomal structure/biogenesis; (pink) transcription; (pale pink) DNA replication/recombination/repair; (forest green) cell division/chromosome partitioning; (yellow) post-translational modification/protein turnover/chaperones; (light yellow) cell envelope biogenesis/outer membrane; (light green) cell motility/secretion; (pale green) inorganic ion transport/metabolism; (medium turquoise) signal transduction mechanisms; (purple) energy production/conversion; (light blue) carbohydrate transport/metabolism; (cyan) amino acid transport/metabolism; (violet) nucleotide transport/metabolism; (pale turquoise) coenzyme metabolism; (medium purple) lipid metabolism; (light sky blue) secondary metabolites biosynthesis/transport/catabolism; (light gray) general function prediction only; (dark gray) function unknown. (3) Predicted tRNA coding regions in the clockwise direction (red in the fourth circle) and in the counterclockwise direction (blue in the fifth circle), respectively. (4) Predicted mobile elements in the clockwise direction (red in the sixth circle) and in the counterclockwise direction (blue in the seventh circle), respectively. The vertical lines indicate predicted transposase genes, and the boxes indicate virus-related regions. (4) G+C percent content in a 10-kb window and 1-kb incremental shift, where the values larger than the minimum value (38%) are plotted (innermost circle).


