
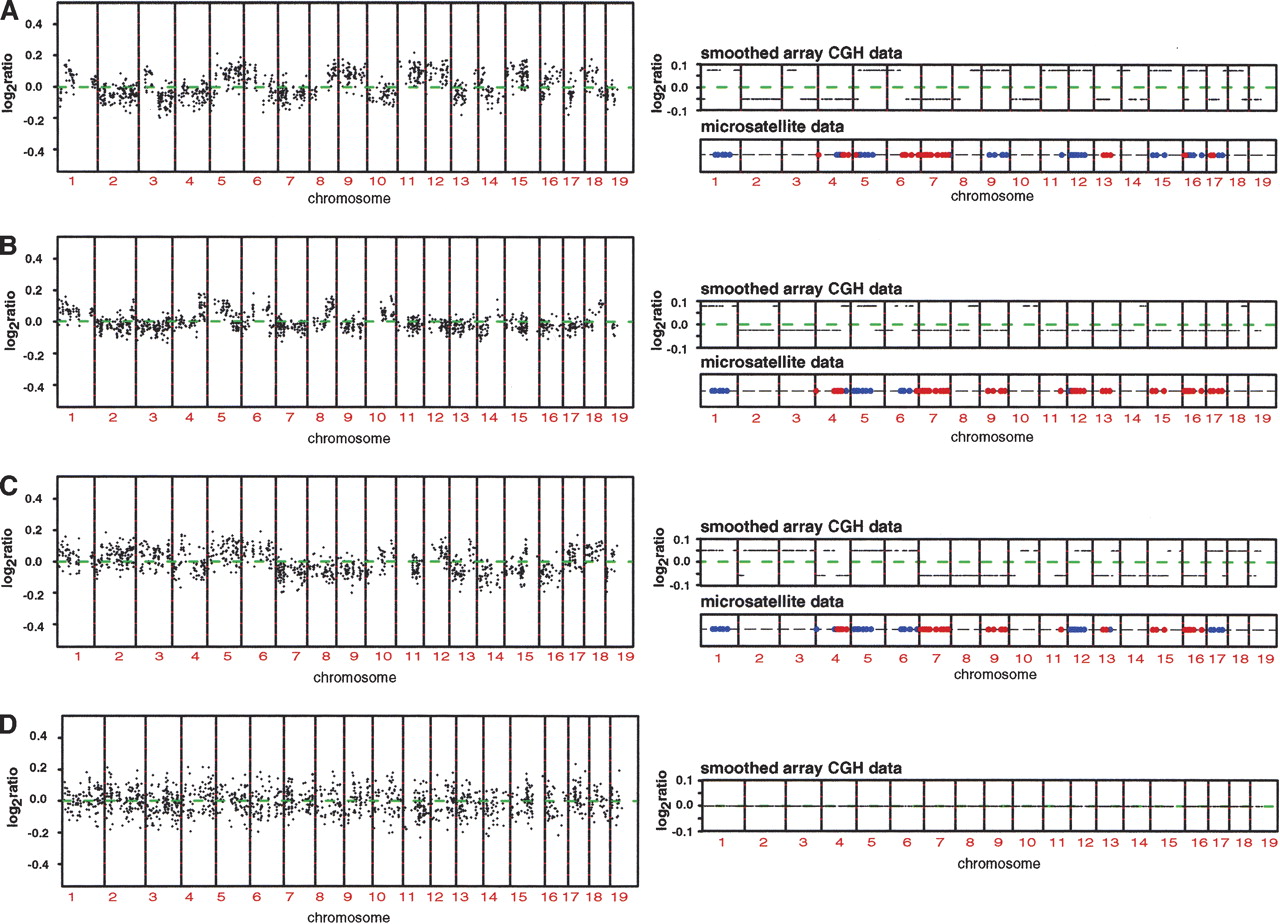
Array CGH mapping of interspecific backcrosses. (A,B,C) Genome-wide DNA copy number profiles of three different individuals from the cross (NIH × SPRET/Glasgow) F1 × NIH using NIH genomic DNA as a reference. We normalized these ratios relative to the ratios from the hybridization of the (NIH × SPRET/Glasgow) F1 parent versus NIH as a reference, in order to minimize fluctuation in ratios due to technical sources. Note the small deviations in copy number ratio around zero (average log2ratio < 0.2). The panels on the right show the smoothed genome-wide DNA copy number profiles and microsatellite mapping data for ∼100 markers across the genome for each of the different mice. Blue indicates regions determined to be homozygous and red regions heterozygous for NIH by microsatellite mapping. We confirmed these observations by carrying out two more hybridizations. First, we repeated the hybridizations for all three mice and found all previously observed ratio changes, and second, we did a dye-swap experiment, which resulted in the expected inversion of the ratio changes (data not shown). Microsatellite mapping agrees with the observed subtle changes in the log2ratio and indicates that relative increases in the log ratio are regions homozygous for NIH, while regions of the genome that exhibit a relative decrease in the log2ratio correspond to regions heterozygous for NIH. (D) Genome-wide DNA copy number profile (left) and smoothed genome-wide DNA copy number profile (right) of the (NIH × SPRET/Glasgow) F1 parent using NIH as a reference. Note the absence of subtle copy number deviations as observed in A,B,C.


