
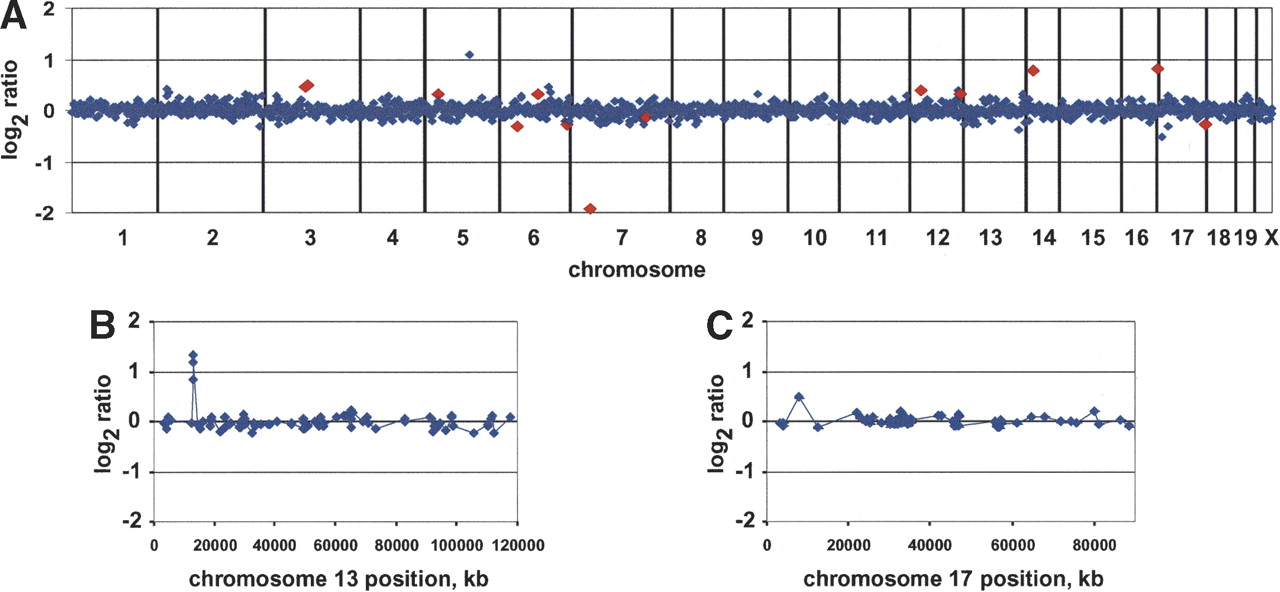
Array CGH profiles. (A) Normalized genome-wide DNA copy number profiles of mouse strain DBA/2J using FVB/N genomic DNA as a reference. BACs are ordered by position on the genome starting with Chromosome 1 and ending with Chromosome X. Vertical bars indicate chromosome boundaries. Each array (MouseArray 3.1) contained 2069 BAC clones, 1848 of which have been mapped onto the draft sequence of the mouse genome (October 2003 freeze). We highlighted in red data points corresponding to a number of the 75 polymorphic clones, which in this individual showed |log2ratio| > 0.25. (B,C) Normalized DNA copy number profiles of Chromosomes 13 and 17 after hybridization with SPRET/Glasgow and C57BL/6J genomic DNA, respectively, using FVB/N genomic DNA as a reference. Note the high-level DNA copy number polymorphism on the proximal arm of Chromosome 13 showing a gain (log ratio ∼ 1) spanning three overlapping BAC clones. The proximal part of Chromosome 17 shows 2a lower-level DNA copy number polymorphism (log2ratio ∼ 0.5) encompassing one BAC clone.


