
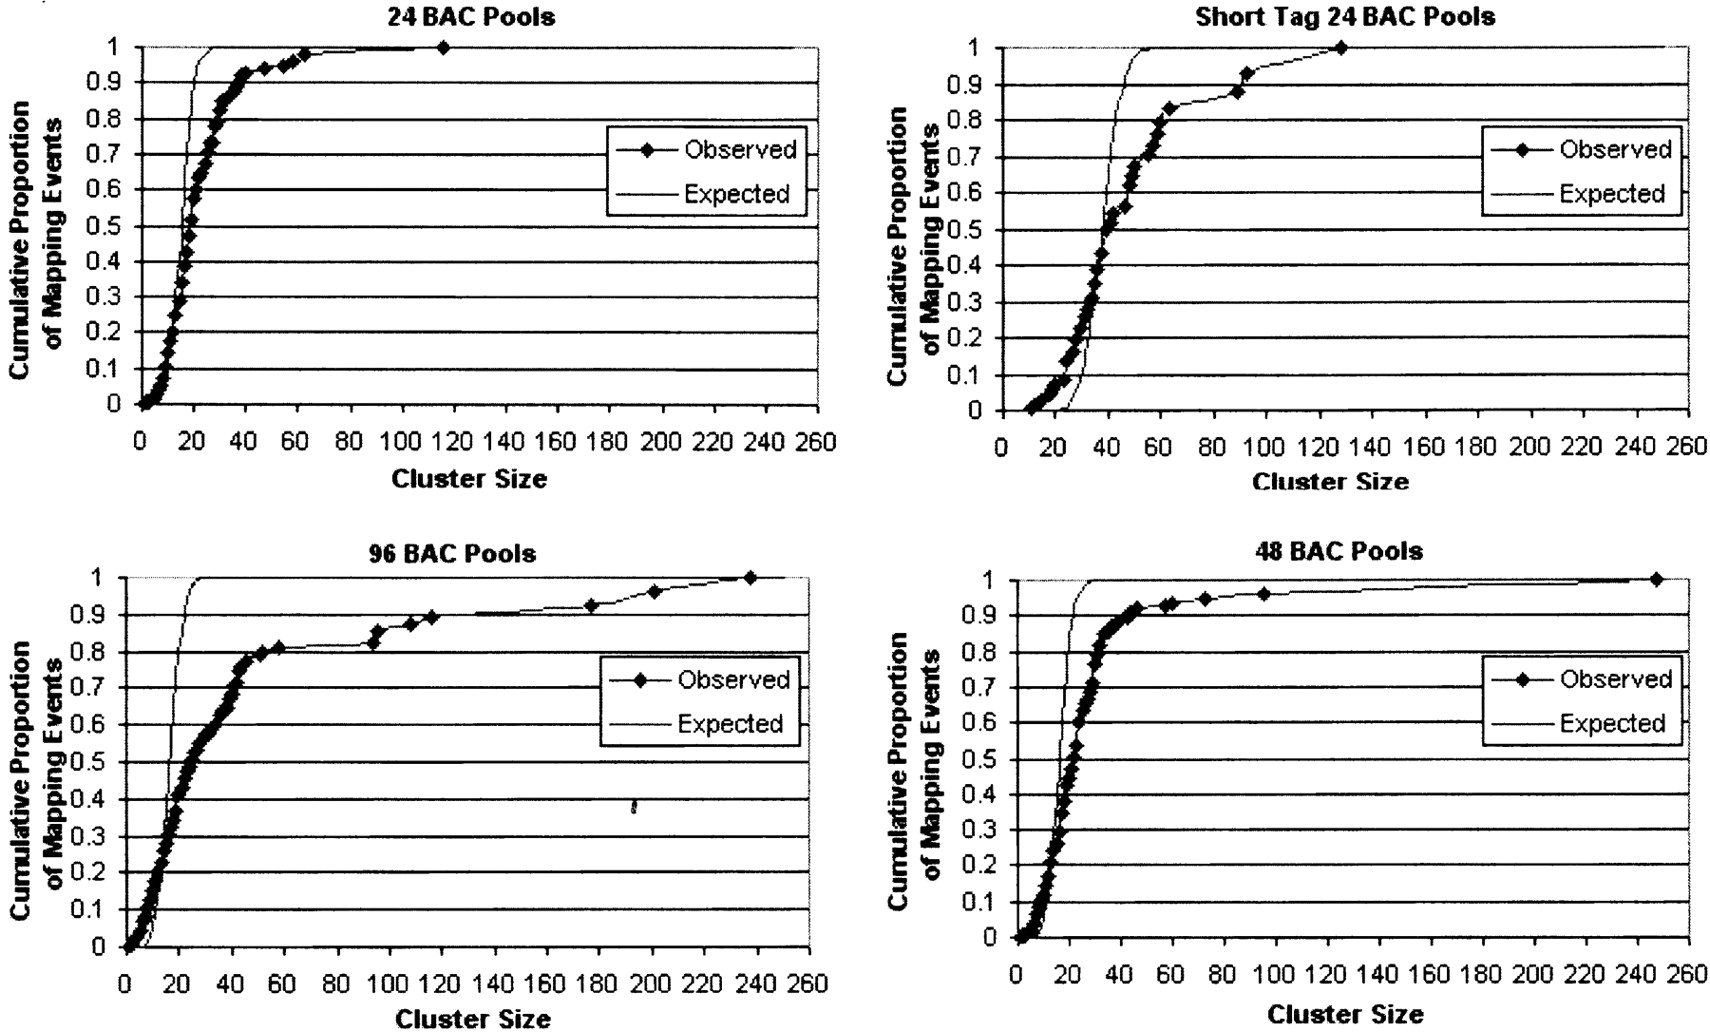
Mapping of reads and tags from pooled rat BACs. Observed and theoretically expected cumulative distributions of mapping events as a function of cluster size are shown for 24-, 48-, and 96-BAC pools and for the ST-PGI method on 24-BAC pools. Points on the observed curve correspond to actual observed clusters. The expected curve is calculated based on the Poisson approximation (lambda = n * p) of the binomial distribution based on observed number of mapping events (n) and clusters (k) and average number of mapping events per cluster (p = n/k). Deviation between observed and theoretically expected distributions indicates bias introduced by oversampling of certain BACs within the pools.


