
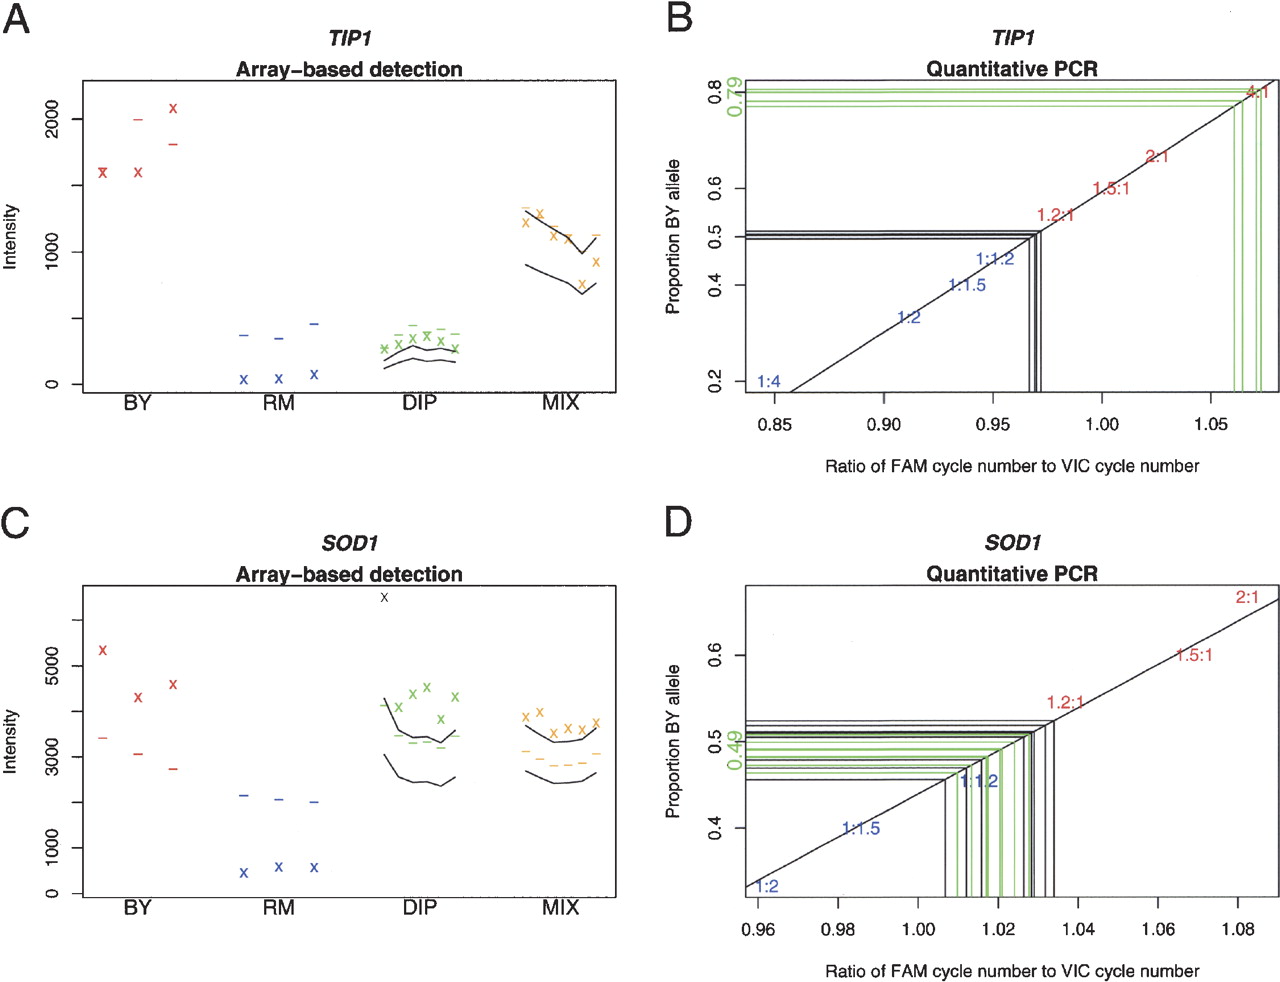
Allele-specific expression analysis and quantitative PCR. (A,C) Array-based detection of allele-specific expression in TIP1 and SOD1, respectively. Note that the observed intensities fall above the predicted range for both TIP1 and SOD1, indicating that the observed to expected intensity ratio is more similar to BY than RM, suggesting that the BY allele is preferentially expressed. (B,D) Quantitative PCR experiments. Green lines indicate the diploid cDNA samples, and black lines indicate the diploid genomic DNA samples. Data points on the standard curve are labeled as parts BY allele: parts RM allele. Blue points represent excess RM allele, whereas red points represent excess BY allele. The estimated proportion of BY allele present in the diploid cDNA is given on the vertical axis in green.


