
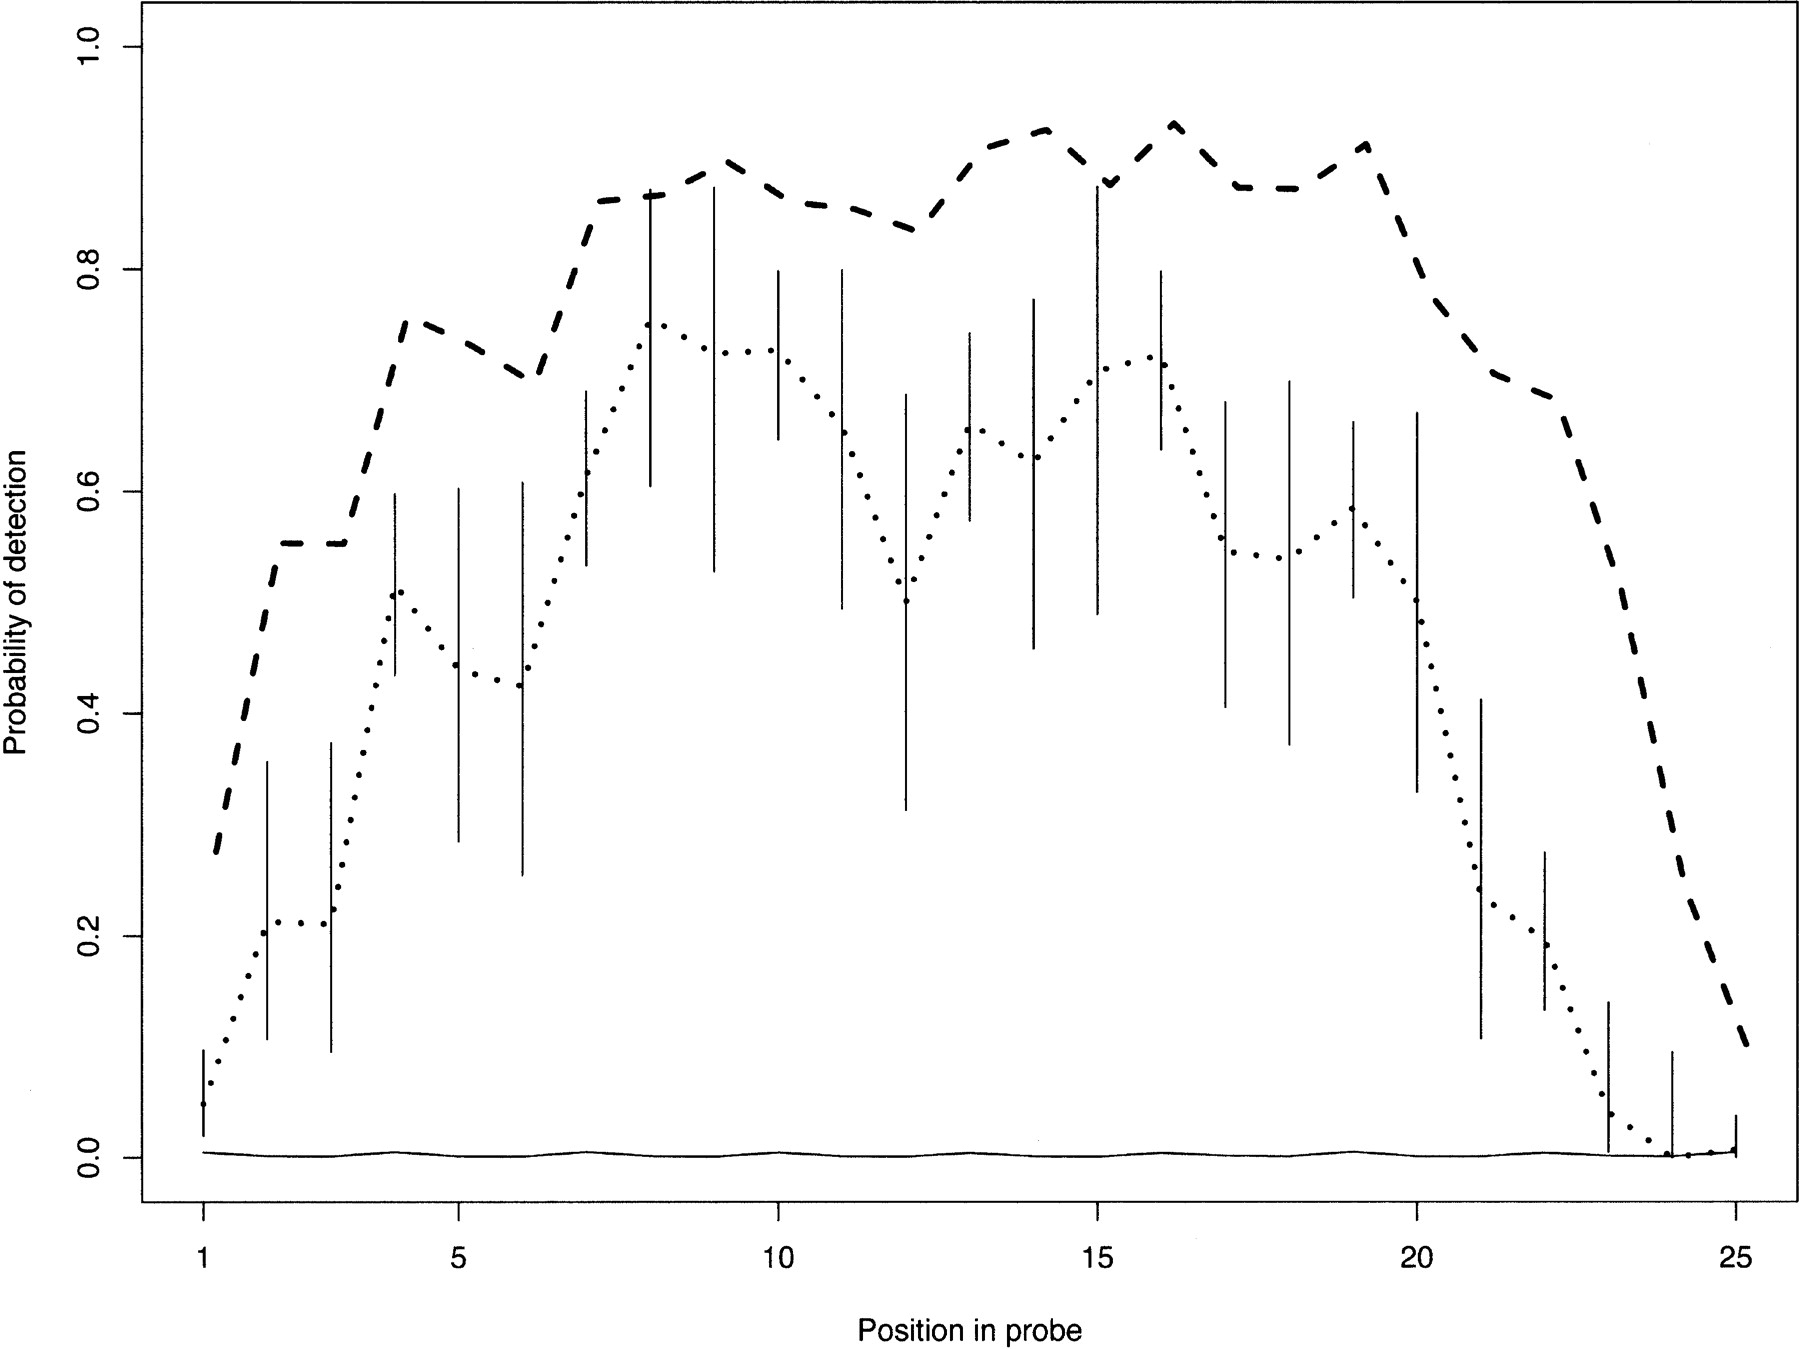
Figure 2.
Sensitivity of polymorphism discovery. The dotted line shows the probability of detecting a single base change as a function of position in the 25 base-pair probe when mRNA material is hybridized to the array. Vertical lines give the 95% confidence intervals for these probabilities. The dashed line shows the probability of detecting single base changes using genomic DNA. The solid line depicts the baseline rate of polymorphism.


