
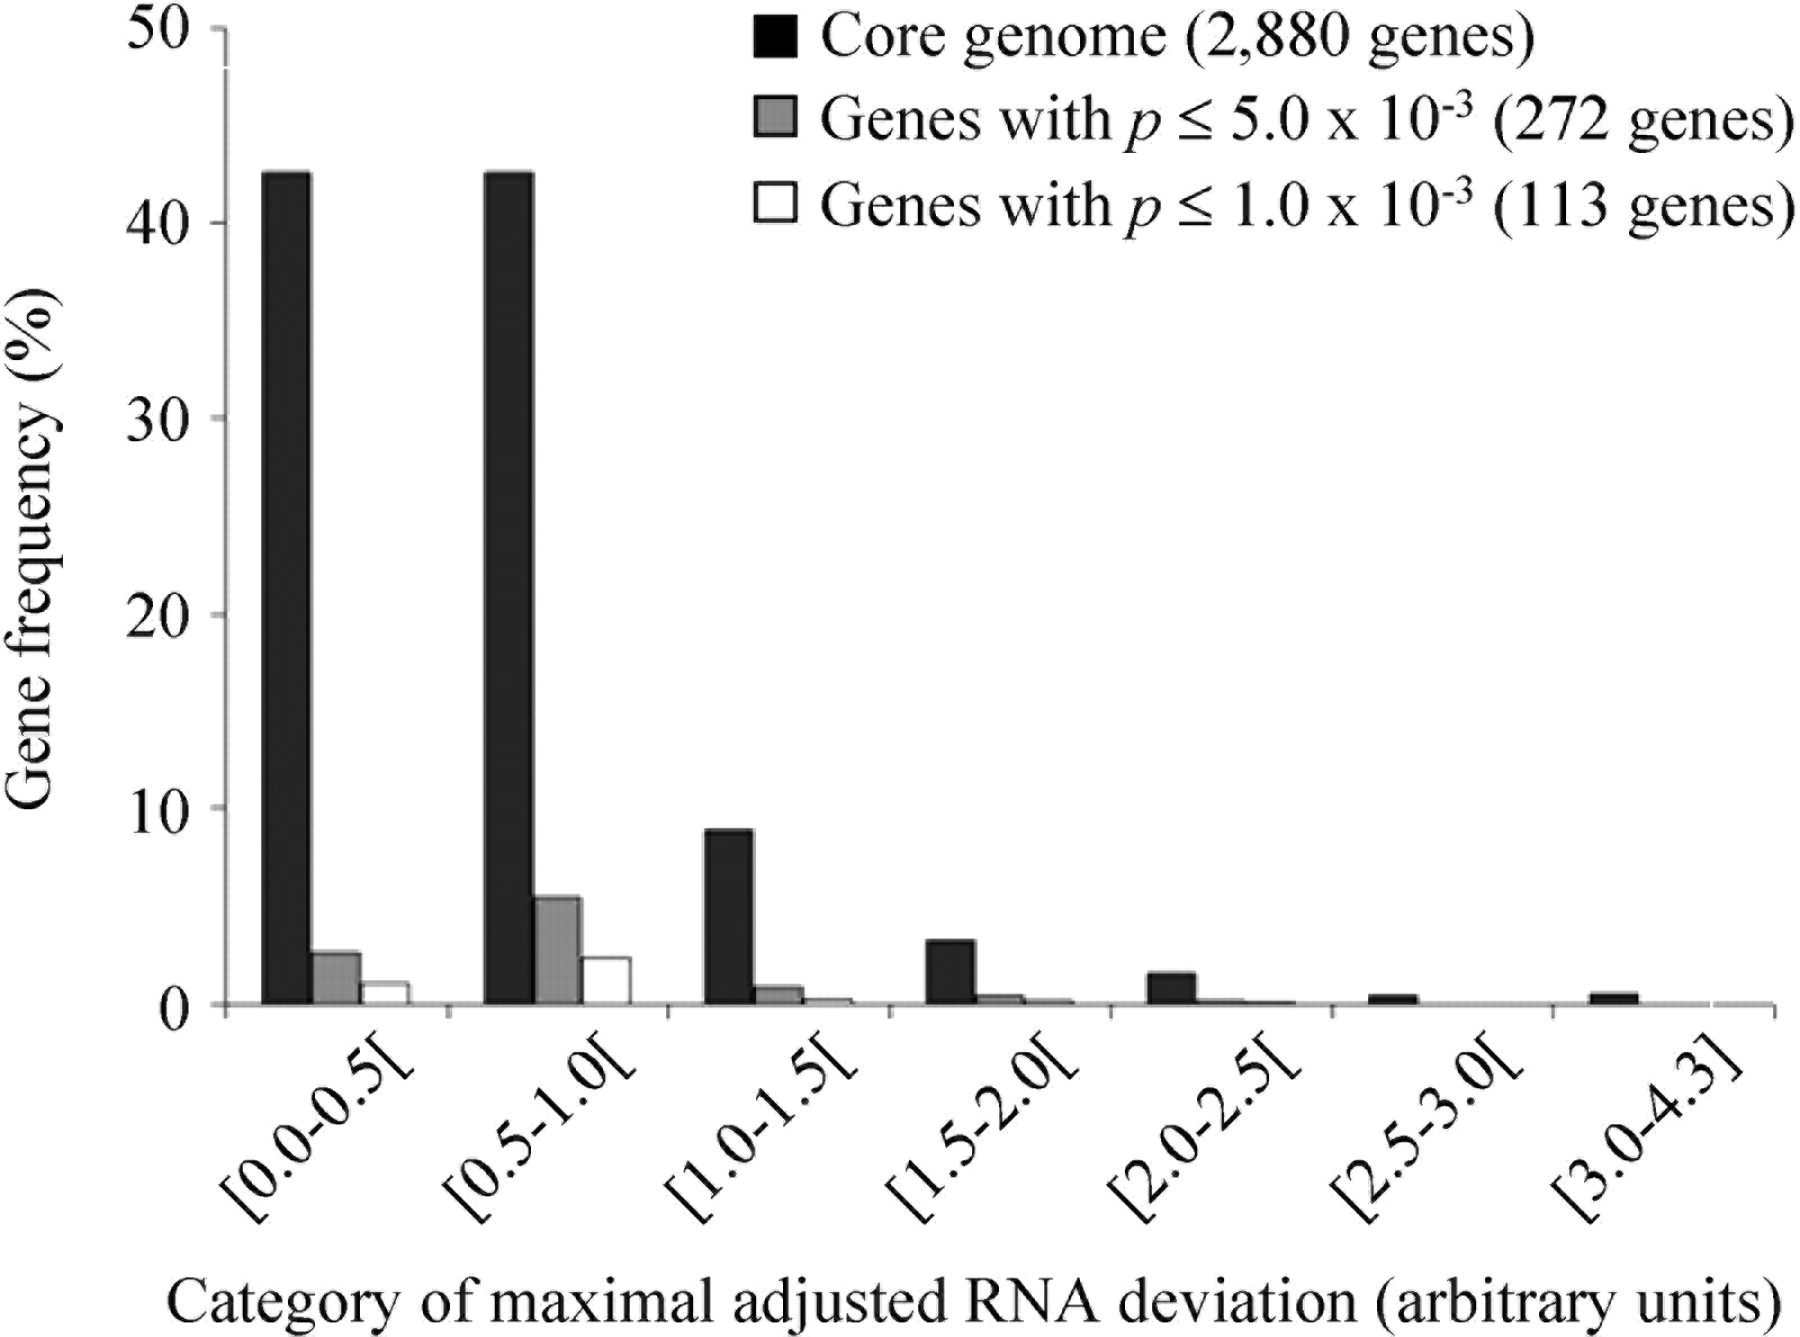
Distribution of maximal adjusted RNA deviations among 11 strains of the E. coli/Shigella species for the 2880 genes of the core genome (black), the 272 genes (gray), and the 113 genes (white) that differentiate the Shigella/EIEC strains from the remaining strains at Student t-test P values ≤5.0 × 10⁻³ and ≤1.0 × 10⁻³, respectively. The maximal deviations (in arbitrary units) were calculated for each gene considering the values obtained for all of the studied strains as the difference between the maximum and the minimum adjusted RNA values. The gene frequency (%) is expressed relative to the 2880 core genome genes for the three data sets (core genome, genes with P ≤ 5.0 × 10⁻³ and ≤1.0 × 10⁻³).


