
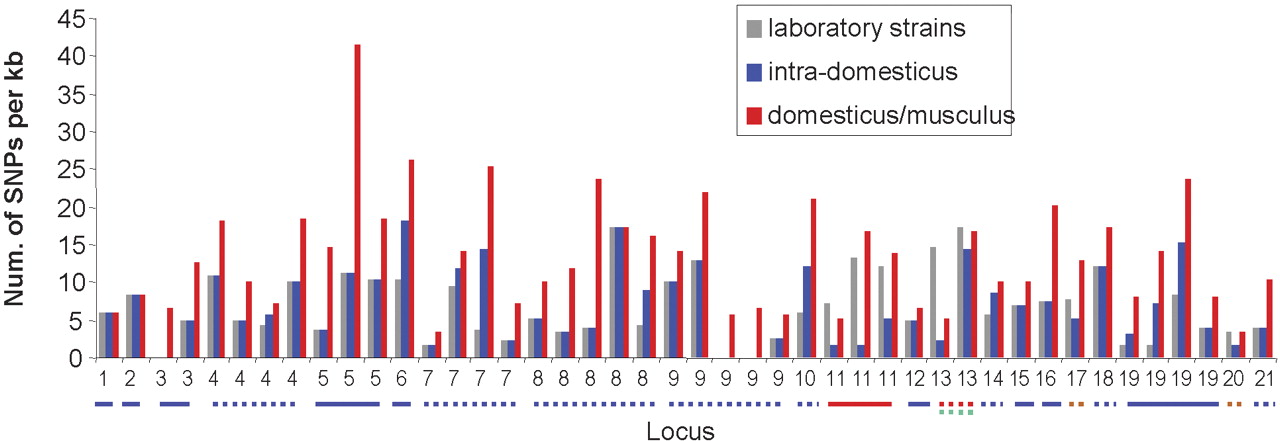
Resequencing results of the 44 genomic segments at 21 genomic loci. The y-axis shows the SNP density (number of the SNPs per kilobase) derived from resequencing that represents variations in 13 laboratory inbred strains, intra-subspecies variations in wild-derived inbred strains of domesticus subspecies (intra-domesticus), and inter-subspecies variations between domesticus and musculus subspecies (domesticus/musculus). At the x-axis, each segment is labeled by its genome locus; multiple segments selected from the same locus are labeled with the same name. Genomic loci are shown in the same numeric order as in Supplemental Table S4. A locus is underlined with a solid line if it is a large haplotype block, a dotted line if it is a fragmented block; the line color indicates whether the variations in the laboratory inbred strains arise from intra-subspecies variations in domesticus (blue), inter-subspecies variations between domesticus and molossinus (red), domesticus versus haplotypes only found in laboratory inbred strains (brown), or molossinus versus haplotypes only found in laboratory inbred strains (green).


