
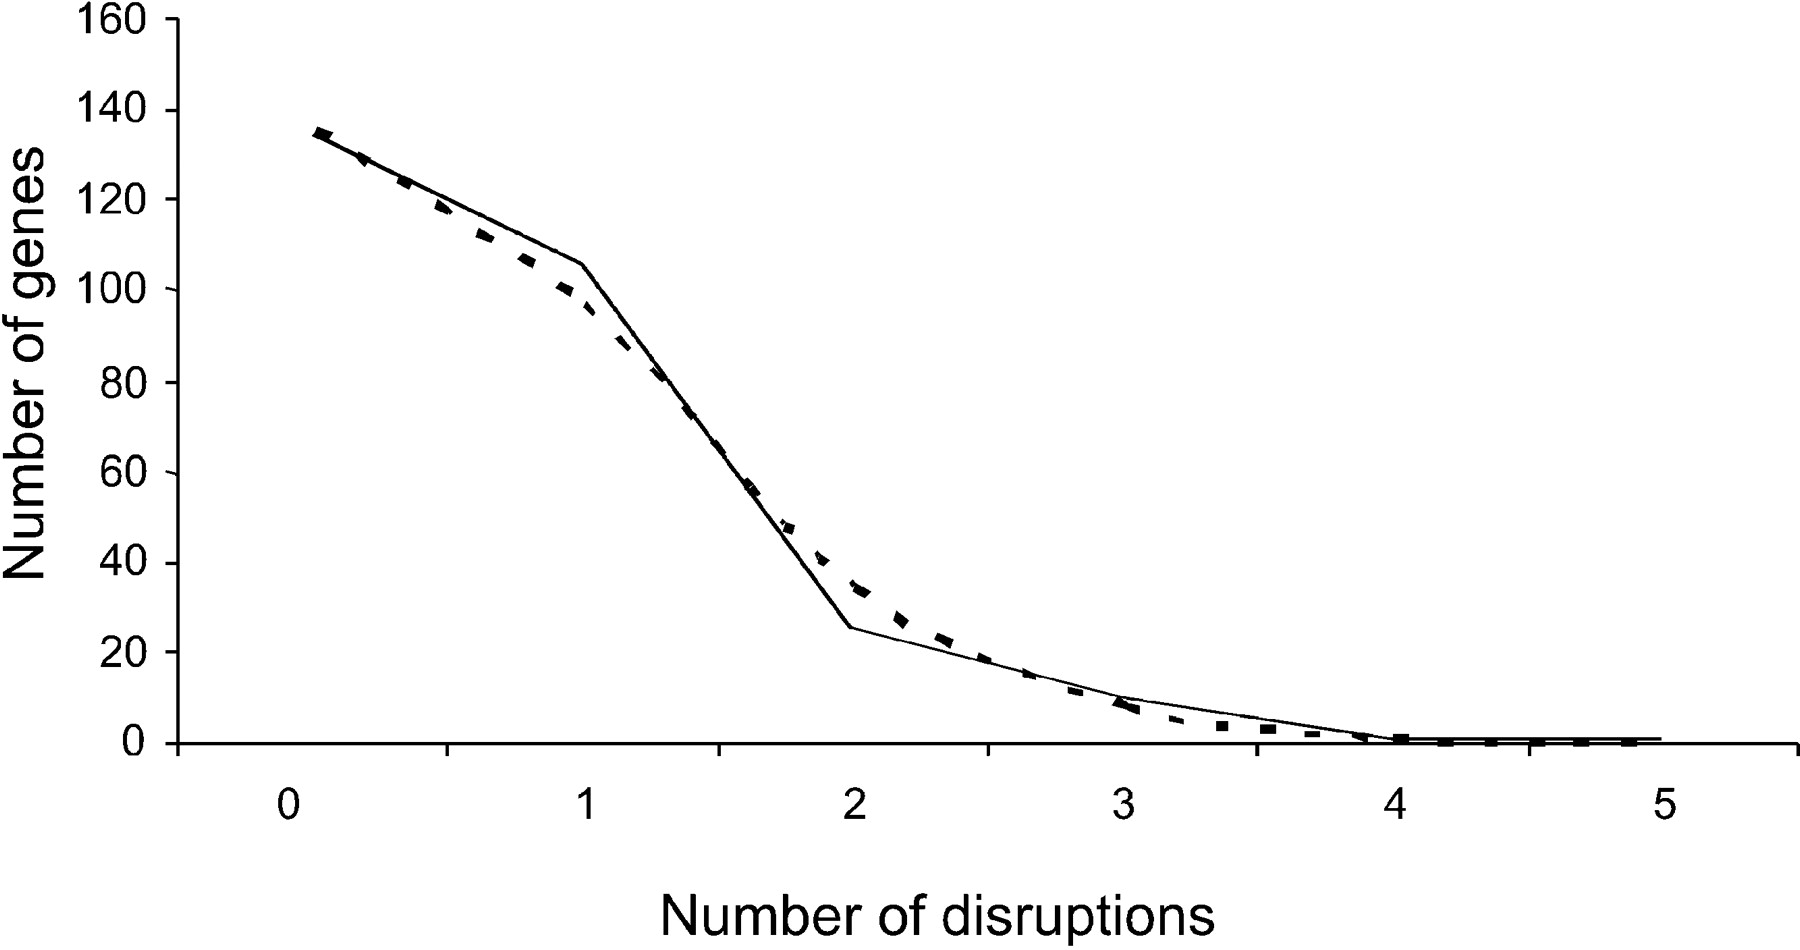
Figure 3.
The distribution of human-specific OR gene disruptions. The broken line is the Poisson fit for the data (λ = 0.701).
(Downloading may take up to 30 seconds. If the slide opens in your browser, select File -> Save As to save it.)
Click on image to view larger version.
The distribution of human-specific OR gene disruptions. The broken line is the Poisson fit for the data (λ = 0.701).
 CiteULike
 Delicious
 Digg
Digg Facebook
 Google+
 Reddit
 Twitter
