
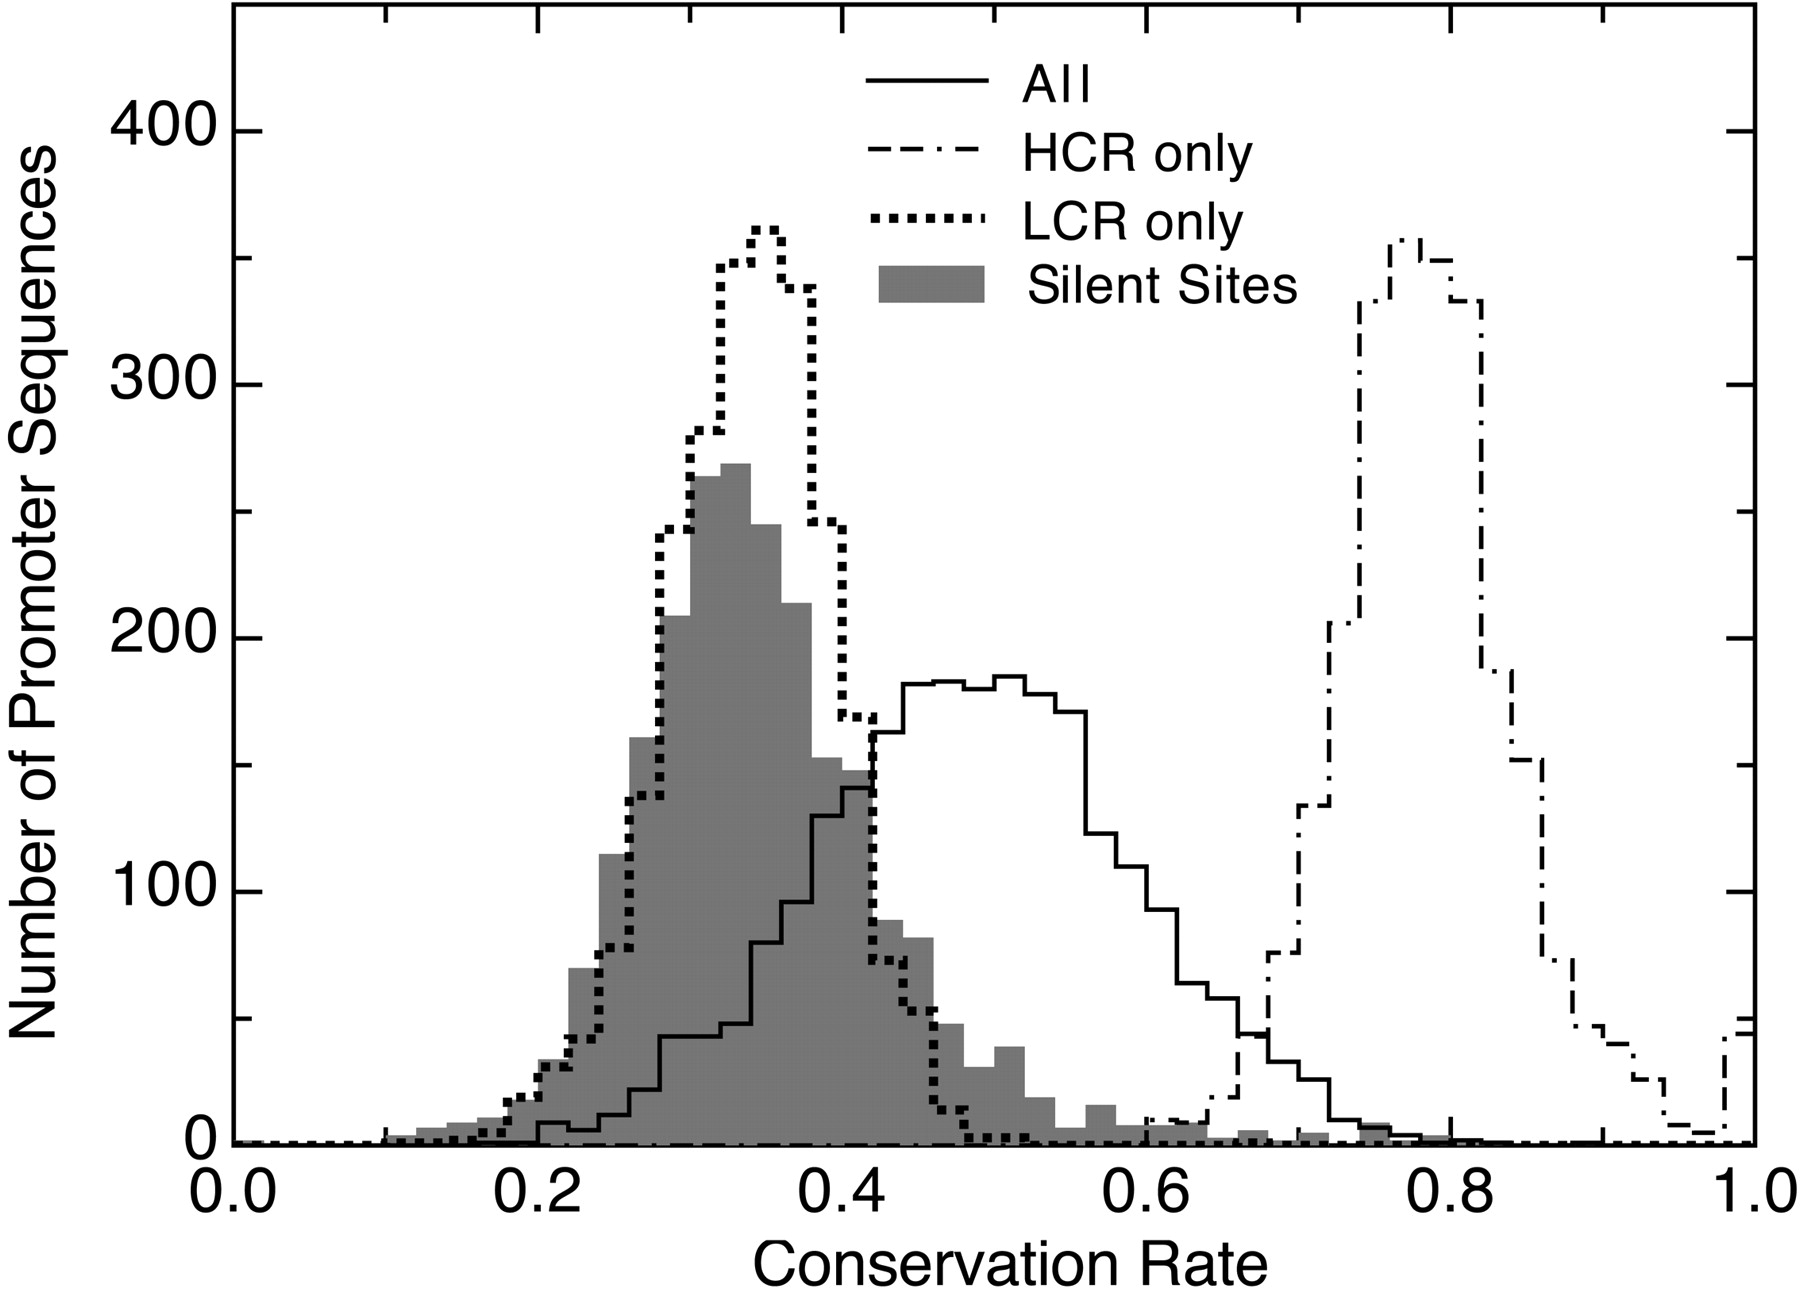
Figure 4.
Distribution of the conservation rate for promoter sequences. The overall conservation rates and the conservation rates within the LCRs and HCRs are calculated for each promoter sequence. Each bin shows how many promoter sequences have the given conservation rate. The distribution of silent site conservation rates in coding sequences, which agrees with the distribution from LCRs, is indicated by the solid bars.


