
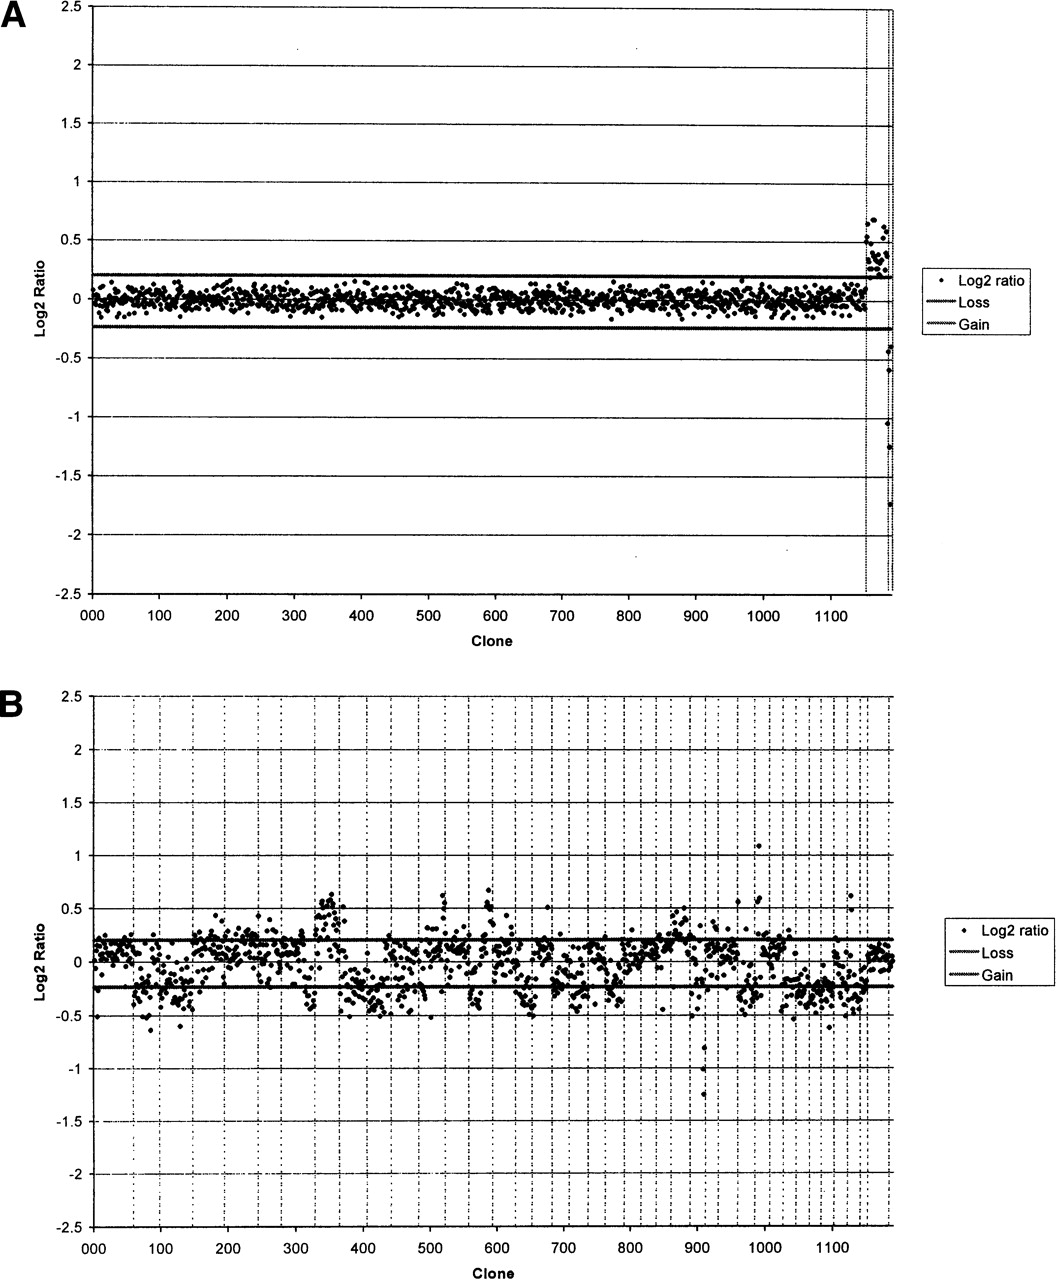
(A) Array CGH profile of a sex-mismatched hybridization performed with normal reference genomic DNA. Data are plotted as the mean, normalized, and background-subtracted log2 ratio of the replicate spots for each clone. Clones are plotted in genomic order from CFA 1qcen to CFA Yqtel. Clones derived from CFA X and CFA Y are shown with vertical broken lines on the right side of the profile. Log2 ratios representing genomic gain and loss are indicated by horizontal bars above and below the midline representing normal copy number. (B) Array CGH profile for case OS-a. Clones representing each chromosome are delineated by vertical bars. The profile demonstrates the range of genomic gains and losses present in the tumor, which are summarized in the text.


