
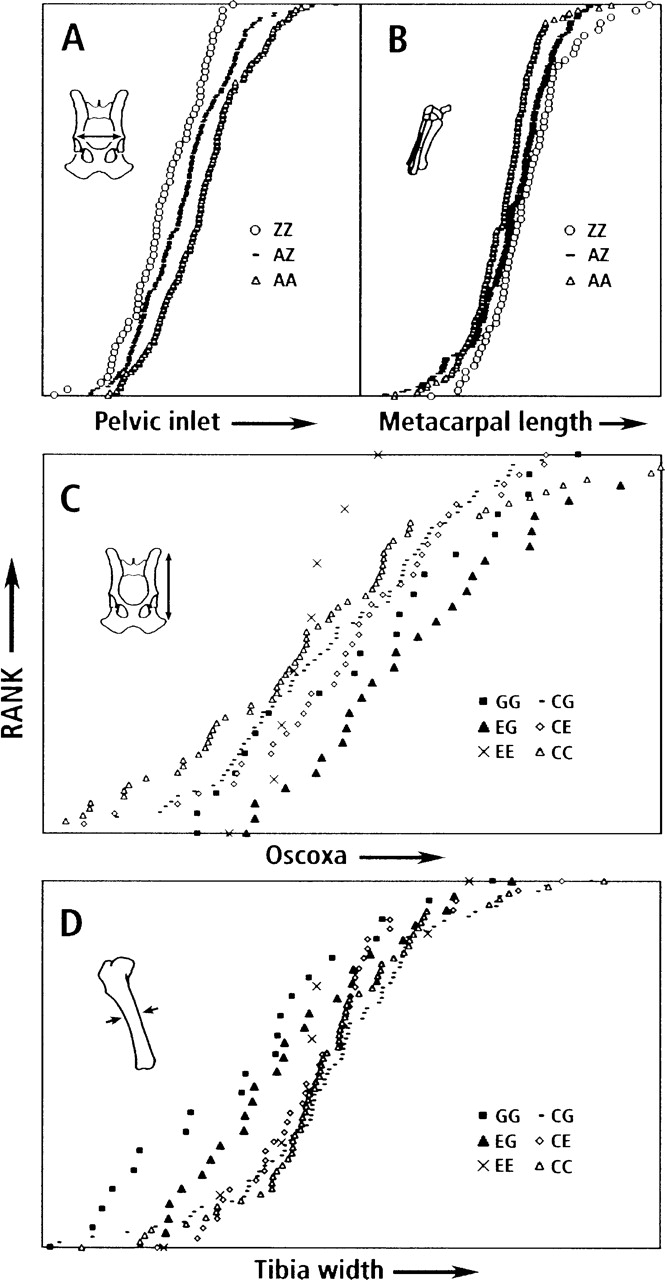
Trade-offs: Effects of genotypes on pelvis and limb bone metrics for PC2 QTLs associated with FH2269 and FH3324. The pelvic inlet (A; see Fig. 2, g) is compared to the length of the metacarpal bone (B); the oscoxa (C; see Fig. 2, f) is compared to the width of the tibia (D). In A and B, the genotypes were simplified by combining haplotypes (B + C = Z). In C and D, only six genotypes are shown: GG and EG are compared with EE, CG, CE, and CC. In each graph, dogs are ranked on the y-axis in order of increasing phenotype (x-axis), resulting in cumulative distributions of phenotypes for each genotype. Pedigree effects were removed by using jackknife techniques. Effects of PCs 1, 3, and 4 also were removed (see Chase et al. 2004). Thus, x-axis values are residuals.


