
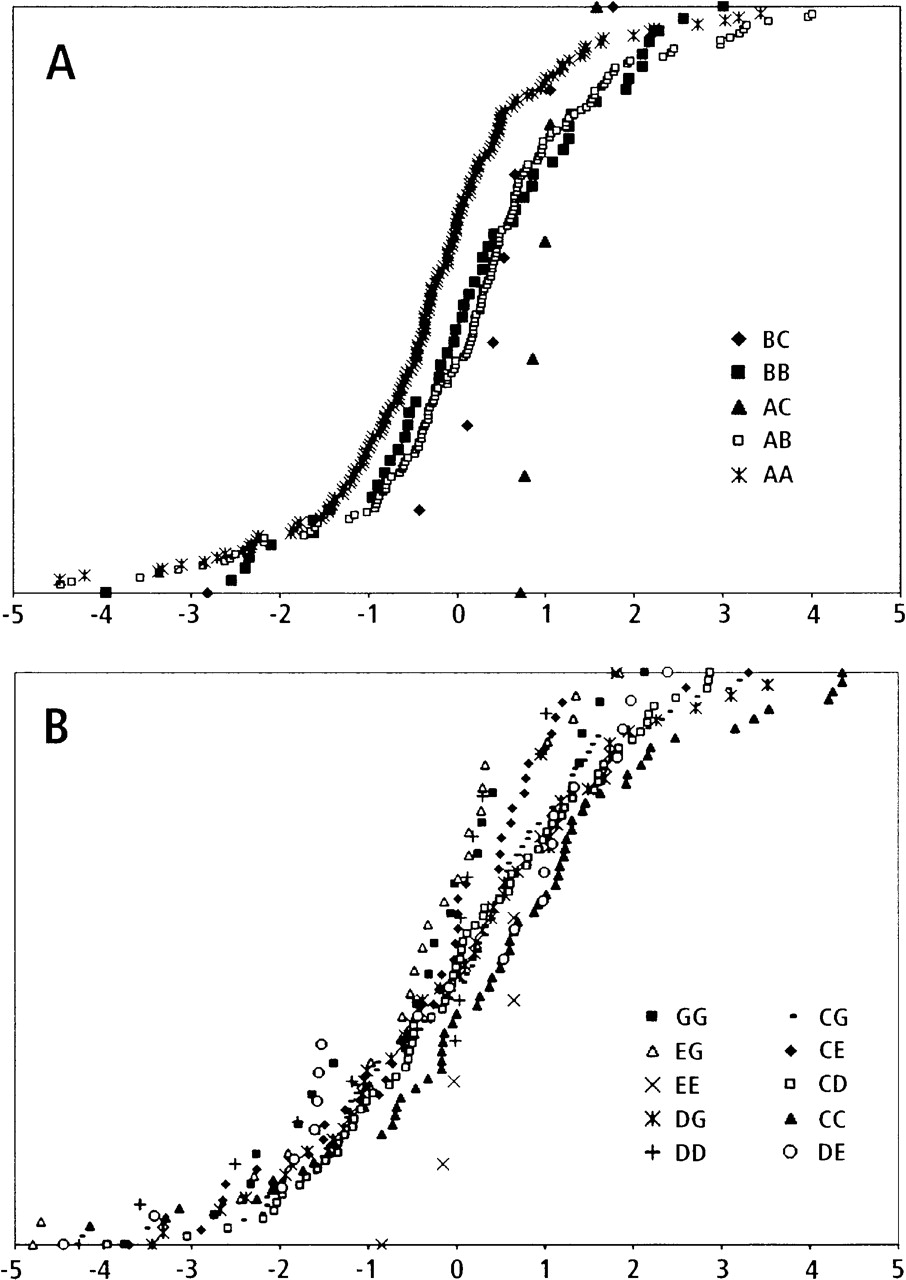
Figure 4.
Simple and complex examples of PC 2 QTLs. (A) All FH2269 marker genotypes. (B) Ten of >15 FH3324 genotypes are shown. QTLs associated with FH2269 and FH3324 are graphed as cumulative distributions. For each marker genotype, all individuals are ranked on the y-axis according to the pedigree-corrected PC2 value on the x-axis. Pedigree effects were removed by using jackknife techniques.


