
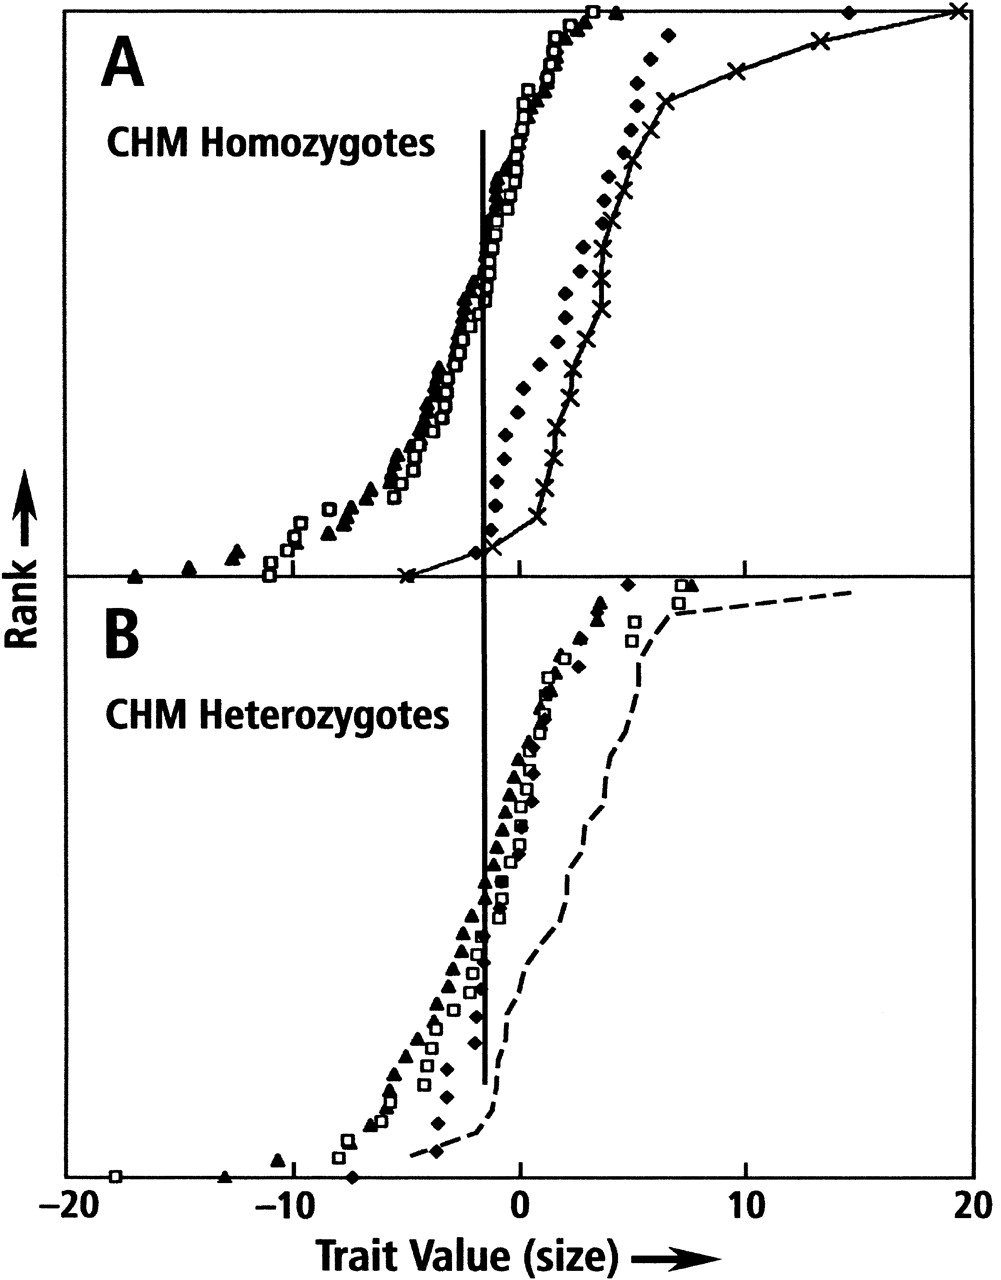
Figure 4.
Size (PC1) distributions of FH2017 genotypes in CHM females: (A) homozygous (αα and ββ); (B) heterozygous (αβ). The data represent genotypic subpopulations of the data in Figure 2. As in Figure 2, dogs are ranked by pedigree-corrected PC1 values on the x-axis. FH2017 genotypes are shown (AA♦; AB□; BB▴). For comparison, male FH2017 AA genotypes (-x-) also are presented. The 50% rankings of BB genotypes (▴) are almost the same (vertical line between A and B). For purposes of comparison, we have added a dashed line to B, reproducing the distribution of AA females from A.


