
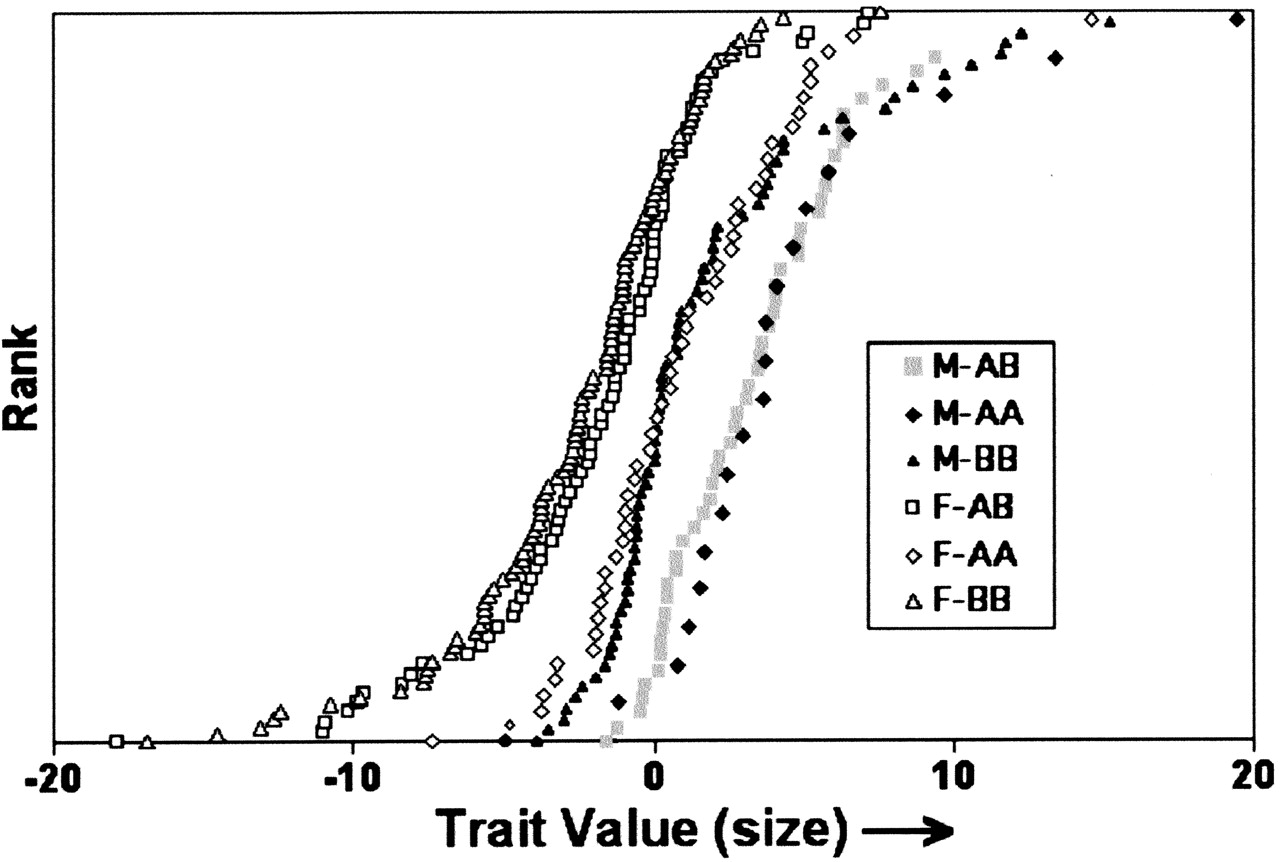
Figure 3.
Size variation (values of PC1) subdivided according to sex and FH2017 genotypes. The FH2017 genotype data in Figure 2 were further subdivided into the male and female subpopulations.
(Downloading may take up to 30 seconds. If the slide opens in your browser, select File -> Save As to save it.)
Click on image to view larger version.
Size variation (values of PC1) subdivided according to sex and FH2017 genotypes. The FH2017 genotype data in Figure 2 were further subdivided into the male and female subpopulations.
 CiteULike
 Delicious
 Digg
Digg Facebook
 Google+
 Reddit
 Twitter
