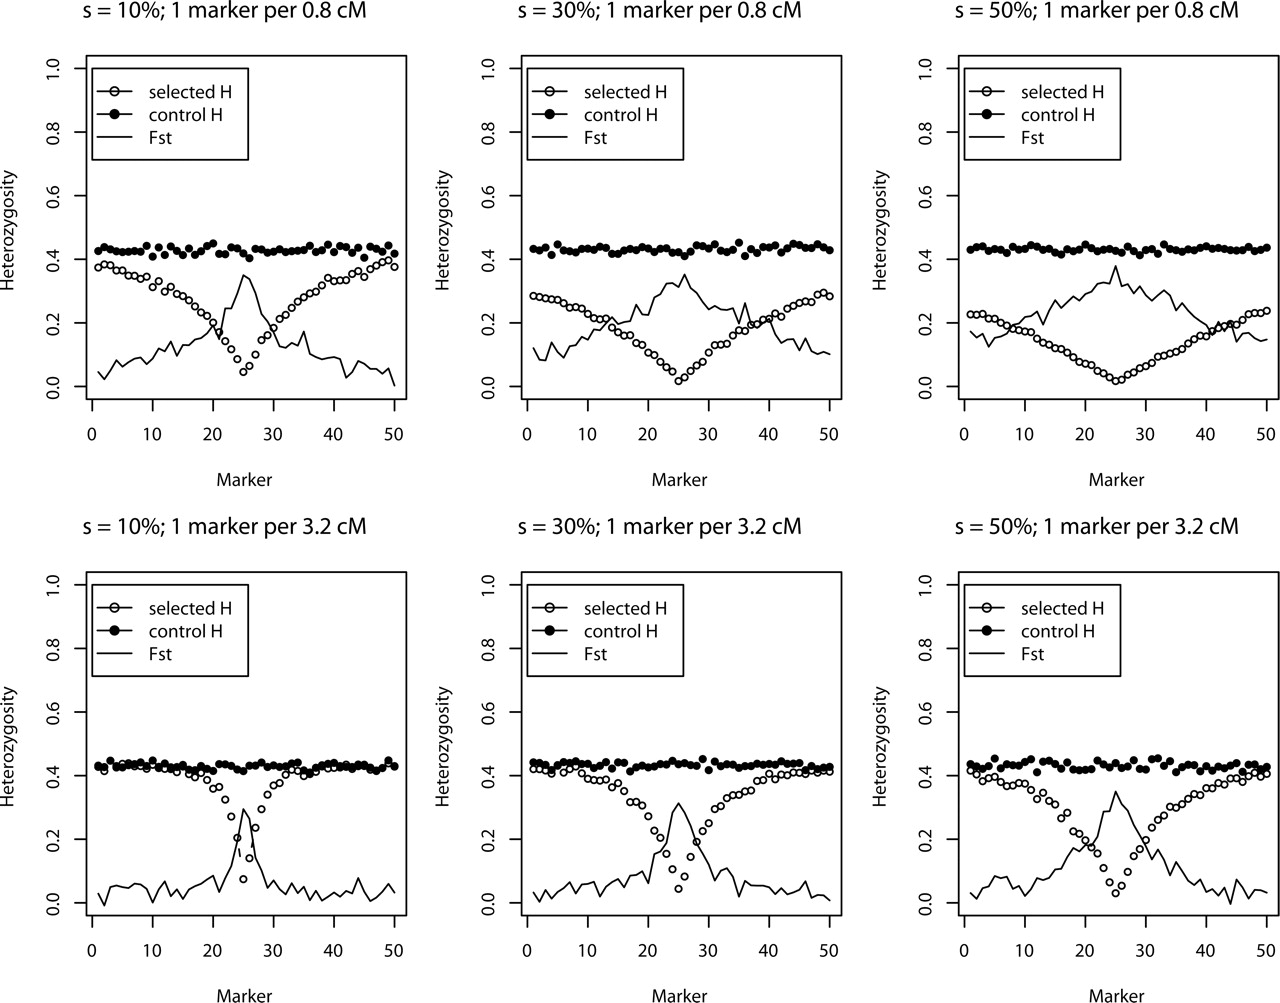
Selective sweep mapping of genes with large phenotypic effects

(Downloading may take up to 30 seconds. If the slide opens in your browser, select File -> Save As to save it.)

Click on image to view larger version.

Figure 3.
Figure 3.

Simulation results summarizing the effect of selection on the average heterozygosity and FST among 200 replicate data sets per parameter combination (selection ranging from 10%-50% for marker density of 0.8 cM and 3.2 cM spacing between markers).

This Article

  1. Genome Res. 15: 1809-1819

Preprint Server