
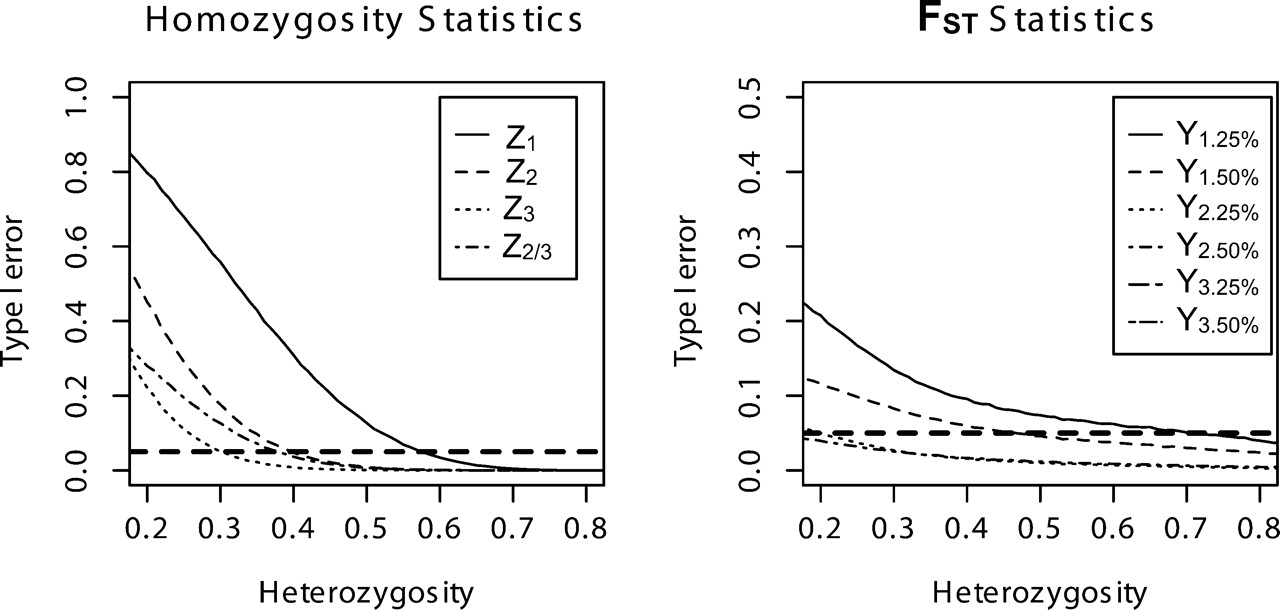
Figure 2.
Effect of heterozygosity on Type I error of all statistics considered in this study across 500,000 simulated replicate data sets. Simulations simultaneously varied time since breed formation, number of breeds compared, number of chromosomes sampled per breed, extent of bottleneck, duration of bottleneck, marker variability and density, and size of ancestral population.


