
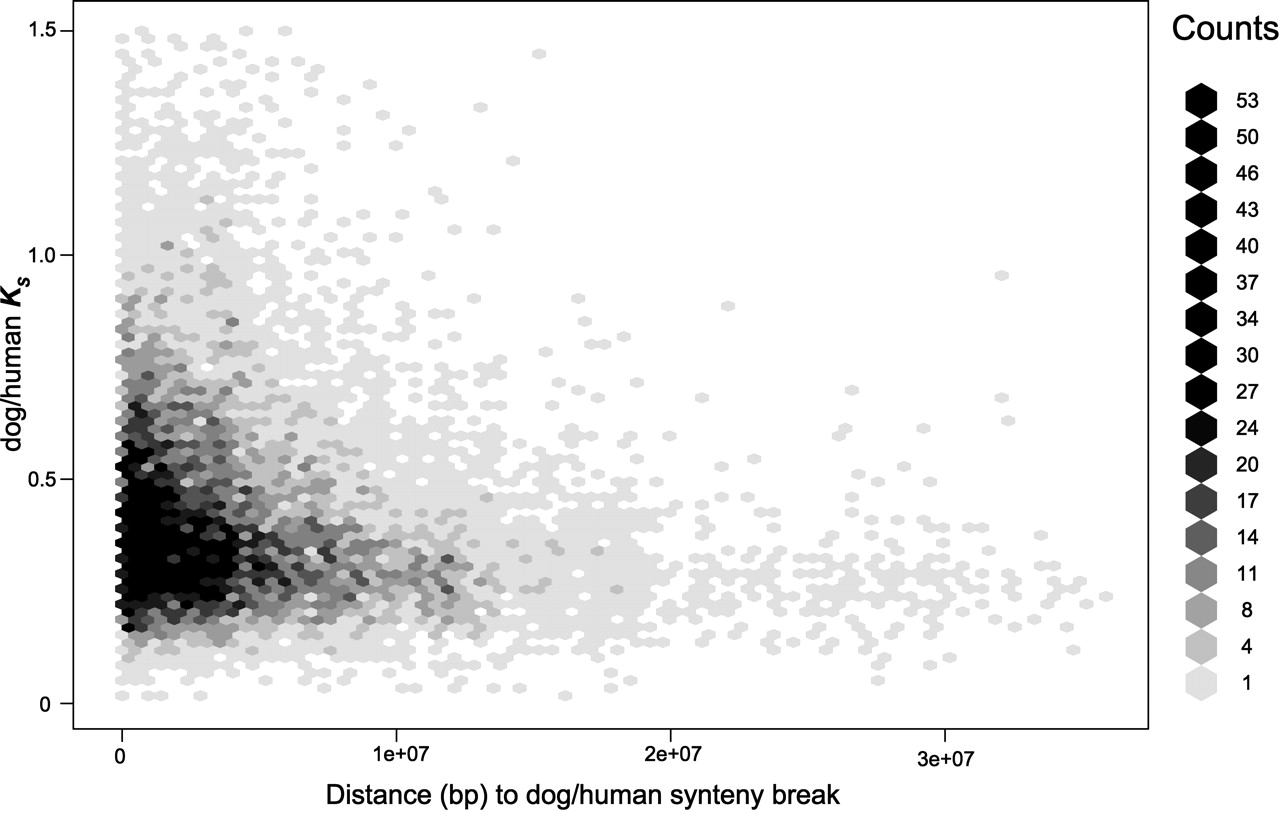
Figure 5.
Density of dog/human orthologs' Ks values versus distance of the dog ortholog to a dog/human synteny breakpoint. The density color key is shown to the right of the plot. Increasing Ks and gene G+C content at fourfold degenerate positions (data not shown) are each significantly correlated with decreasing distance to a human/dog synteny breakpoint.


