
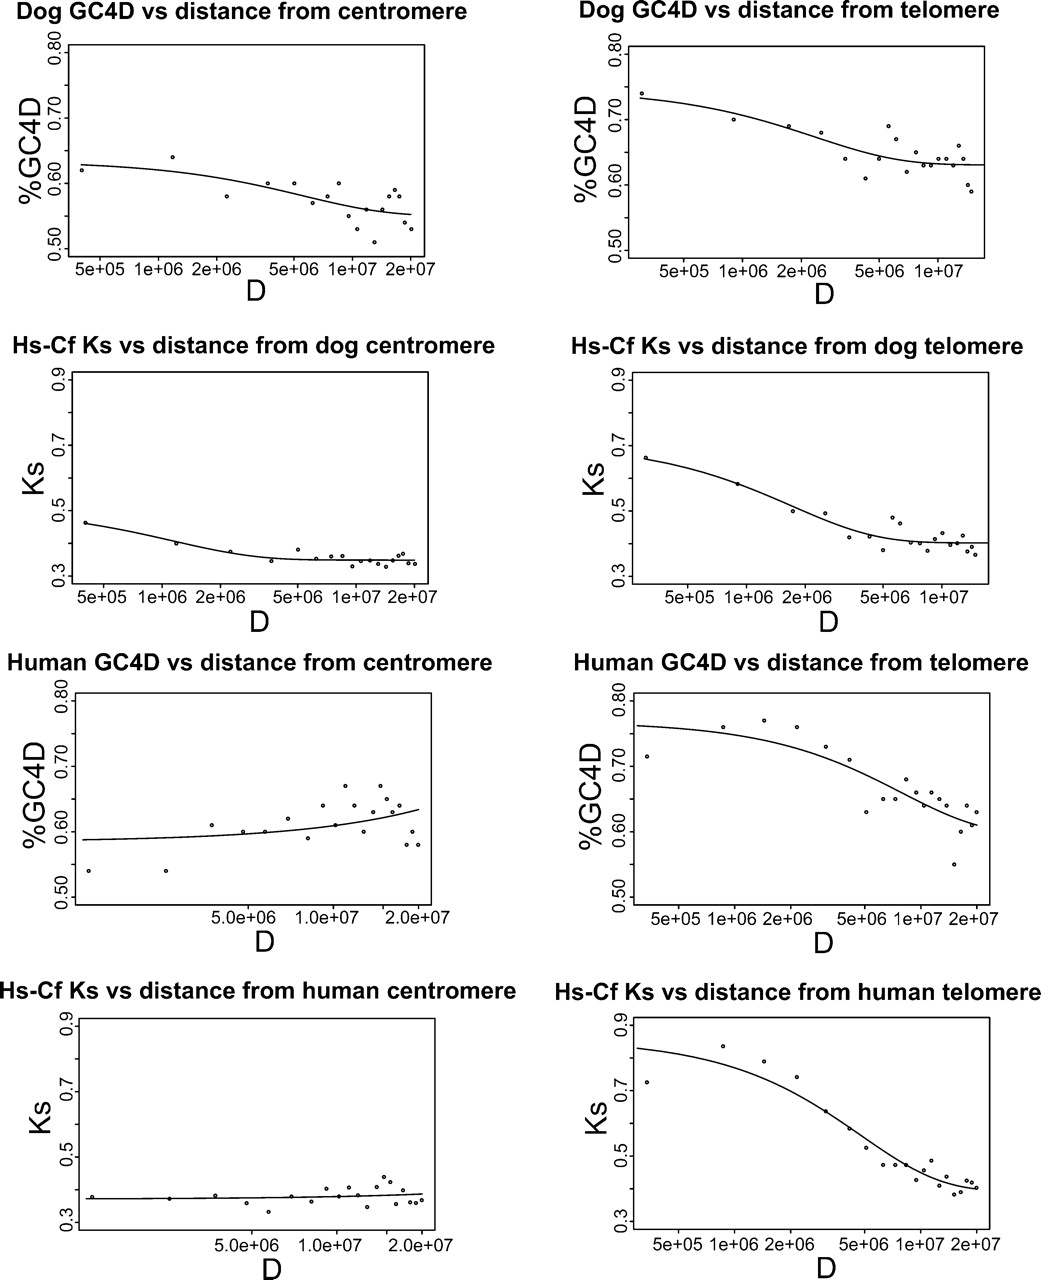
Figure 3.
Variations in median Ks and GC4D percentage of dog and human single orthologs (set D2) with respect to log distance to a dog or human telomere or centromere. Values were obtained from nonoverlapping bins of 200-250 sequential genes. Ks was calculated between dog-human 1:1 orthologs (see Methods). D is the distance in bases. All plots have been fitted with a first-order exponential, y = A + B exp(X/C), except those plotted with respect to distance from the human centromere, which are fitted with straight lines.


