
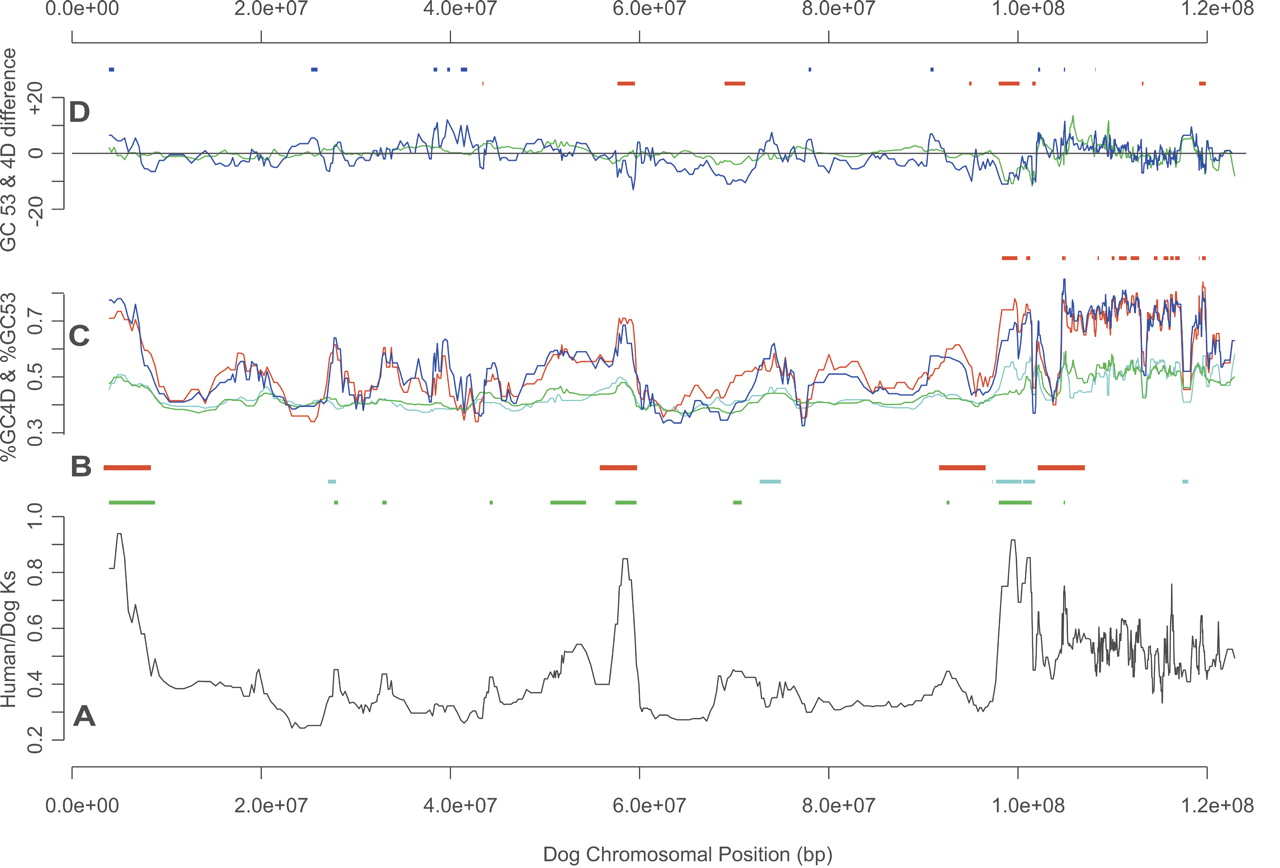
Variations in dog and human Ks, and different G+C fractions, as functions of distance (in base pairs) along dog Chromosome 1. These quantities are shown as median values for 10 gene overlapping windows (see Methods). (A) The variation in Ks values (in black) of dog and human orthologs along this chromosome. Ks value hotspots are indicated in green above A. (B) The syntenic locations (see Methods) of human telomeres (in red) on dog Chromosome 1. Short synteny blocks (<4 Mb) are indicated below in light blue. (C) Variations in GC53 or GC4D fractions (as percentages). %GC53 and %GC4D values of dog genes are shown in light blue and red, respectively, whereas %GC53 and %GC4D values of their human orthologs are shown in green and dark blue, respectively. %GC4D hotspots, exceeding the 80th centile for the whole chromosome (see Methods), are marked above C in red. (D) The differences in %GC53 (ΔGC53, dark blue), and in %GC4D (ΔGC4D, green), between dog and human orthologs. Above D, ΔGC4D hotspots (i.e., dog regions elevated in GC4D, with respect to human orthologs; see Methods) are indicated in red, whereas ΔGC4D cold spots (i.e., dog regions suppressed in GC4D, with respect to human orthologs; see Methods) are shown in blue.


