
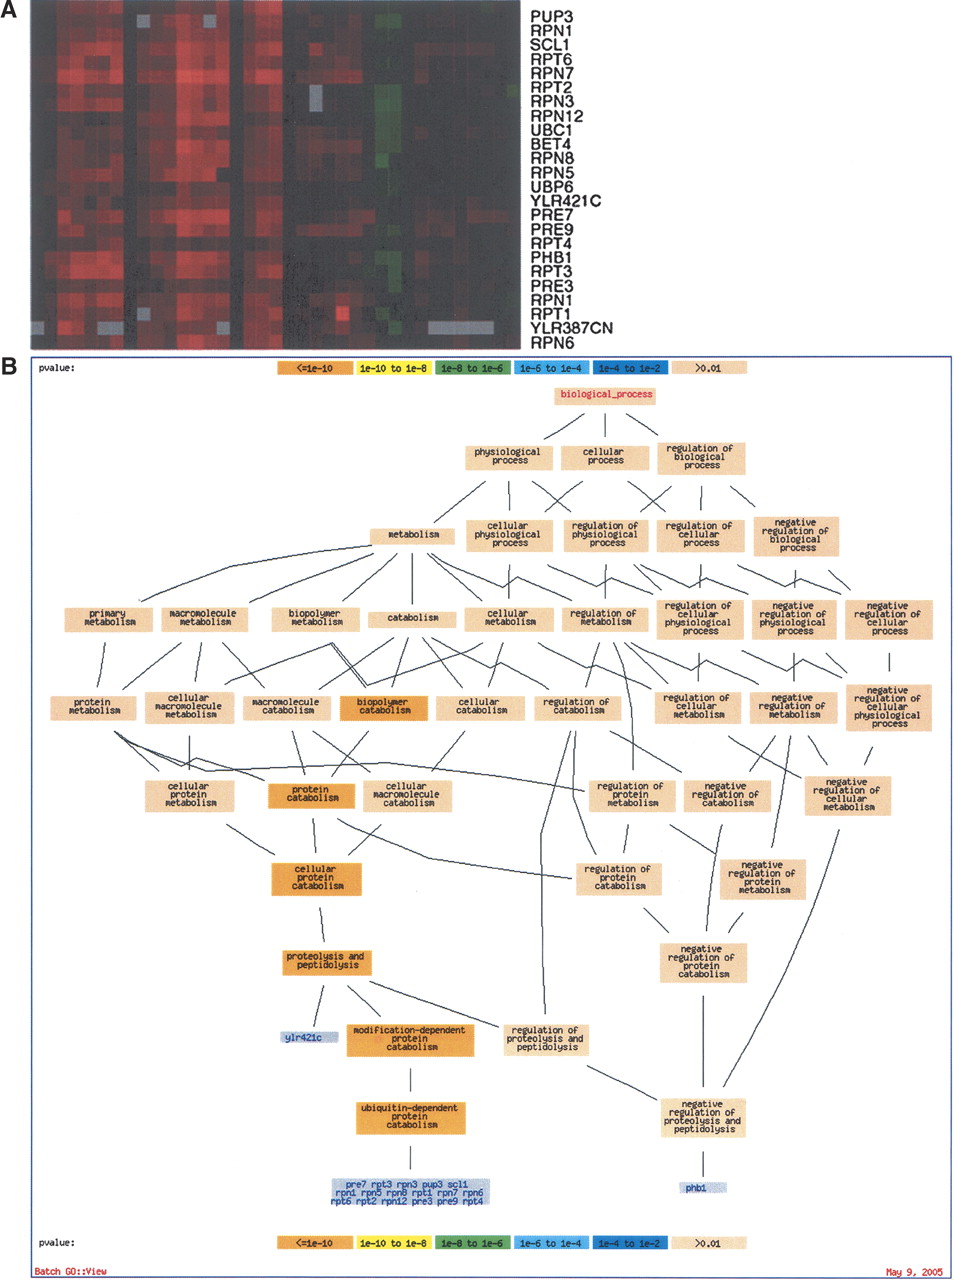
Figure 2.
(A) Display of a group of genes that exhibit similar expression during the DNA damage response as described in Gasch et al. (2001). Red indicates increased expression, while green indicates decreased expression levels. Each gene's expression is represented by a single row of colored boxes, while each sample is represented by a single column. (B) GO Term Finder results with the cluster from A as input; the most significant enriched GO Term is “proteolysis and peptidolysis,” with a P-value of 1.26–28.


