
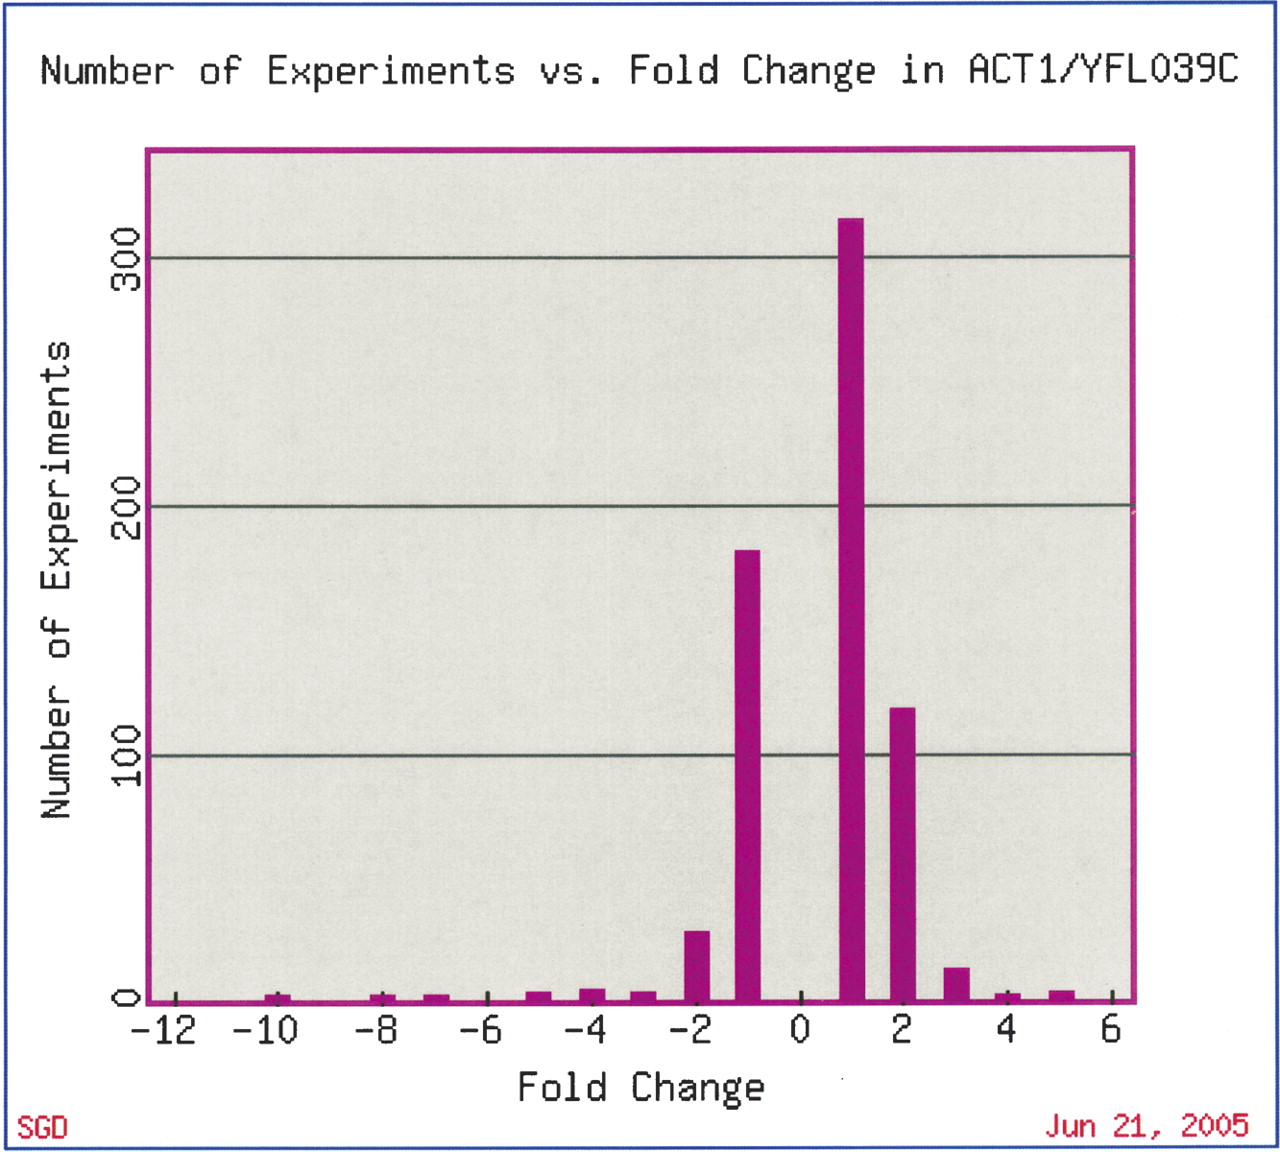
Figure 1.
Fold change of ACT1 gene expression in microarray experiments available at SGD. This figure was generated by the SGD Expression Connection tool at http://db.yeastgenome.org/cgi-bin/expression/expressionConnection.pl. The outlying values (–10, +fivefold) are experiments from the Mnaimneh et al. (2004) data set that profiled expression in strains with essential genes under control of titratable promoters. Other conditions that led to at least fourfold change in ACT1 expression include expression during sporulation (less than fourfold) (Chu et al. 1998) and prolonged stationary phase (–4.3 fold) (Gasch et al. 2000).


