
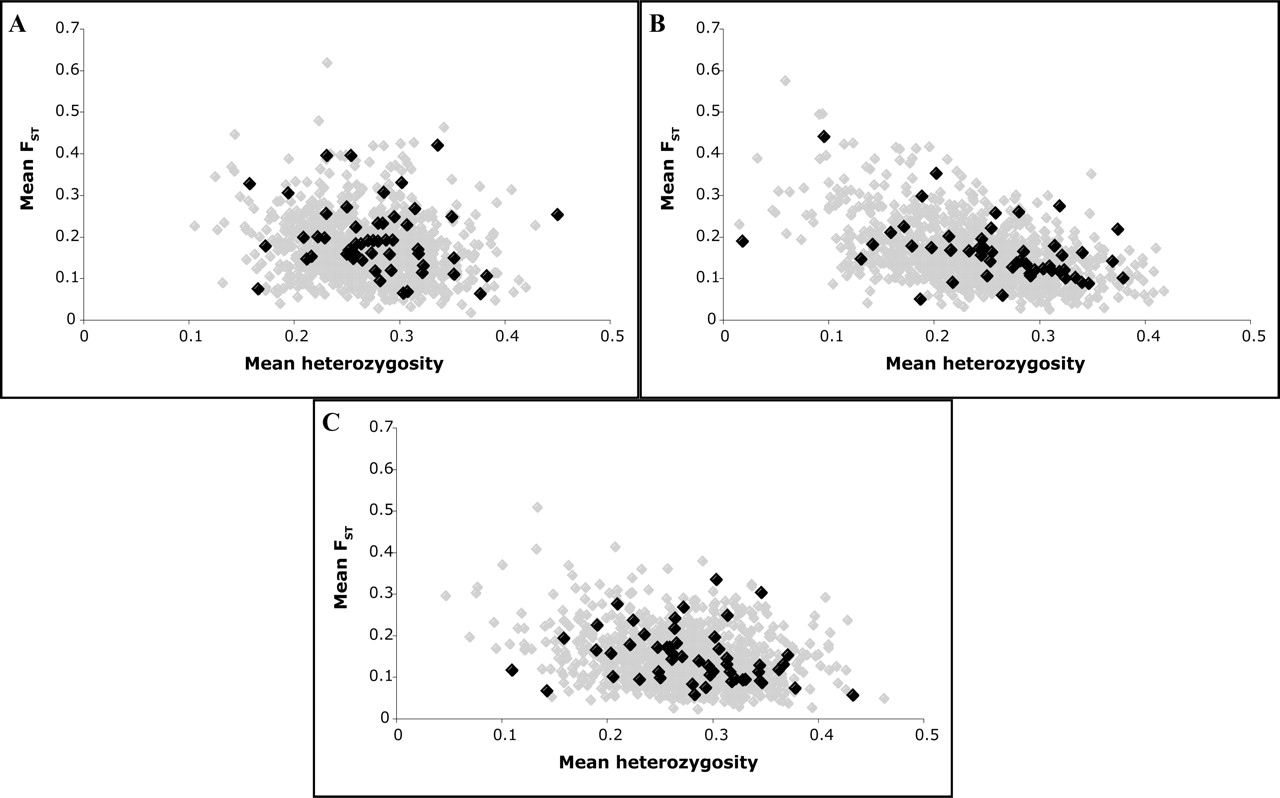
Figure 5.
Comparison of best-fit model with data: 52 gene regions. Here 40 genes are genotyped in three populations; long genes were subdivided into smaller regions. The mean FST and heterozygosity are shown (black), and compared to the same measures for simulated data (gray); simulated regions were 120 kb long with 30 ± 10 SNPs per region. (A) Yoruba sample. (B) Chinese sample. (C) CEPH sample.


